
Advisor Blog | May 2024 |
2024 Proxy Season: Early Returns in Oilfield Services
New data showing how the oil and gas industry’s recent strong performance has influenced CEO compensation.

Introduction
2023 was a successful year for the US oil and gas sector, despite a slight downtick from an historic 2022 and an everchanging governance landscape. Buoyed by relatively high oil prices and increasing demand, the US reached a 21% world market share, the highest among all oil and gas producing nations.
Based on early public company proxy filers, we summarized the impact of the industry’s strong performance on recent CEO compensation disclosures in the oilfield services (OFS) subsector. We have consolidated the compensation data for the industry’s earliest public filers, a group representing 18 oilfield services companies with revenues ranging from approximately $400 million to $34 billion over the last 12 months, and compared their target compensation figures to the 2022 data of the same firms. Topics covered include:
- Base salary changes;
- Annual and long-term incentive trends (target and actual payout); and
- The performance of larger industry players versus the broader OFS sector.
We also analyzed a subset of the aforementioned 18 company group consisting of the top five largest constituents. These firms have a median revenue of $23 billion over the last 12 months and a median market cap of $32.3 billion as of December 31, 2023.
Base Salaries
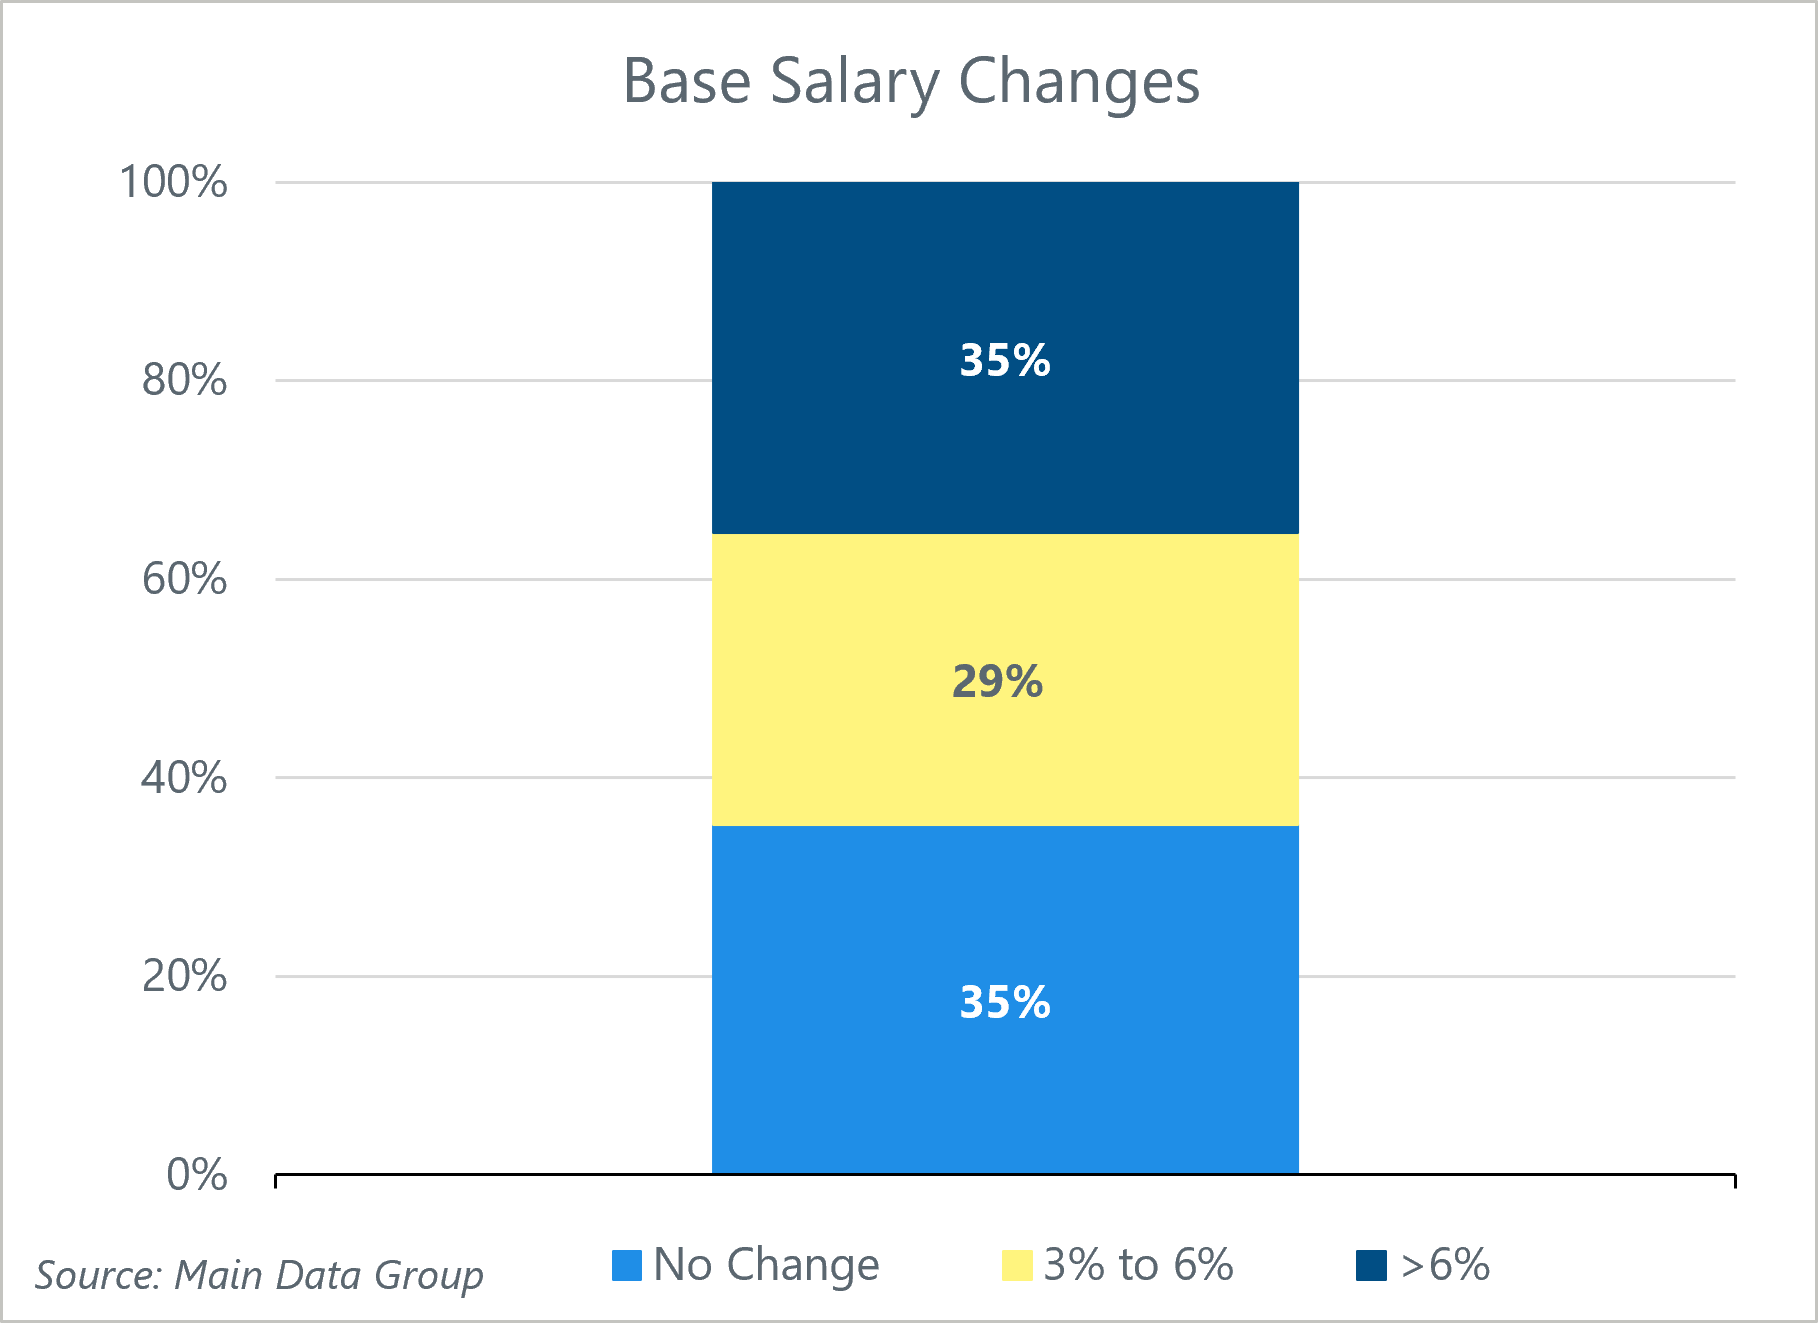
Base salaries continue to grow at a steady pace, particularly for the CEO position, with a median increase of 5%. However, roughly one-third of the group had no change to the CEO’s salary and the majority of increases greater than 5% were CEOs that were relatively new to their role (tenure in the position between two and three years).
We also analyzed a subset of the aforementioned 18 company group consisting of the five largest constituents. These firms have a median revenue of $23 billion over the last 12 months and a median market cap of $32.3 billion as of December 31, 2023. This subset had a median of 5.1% growth in base salary, which is in line with the broader group median.
Annual Incentives
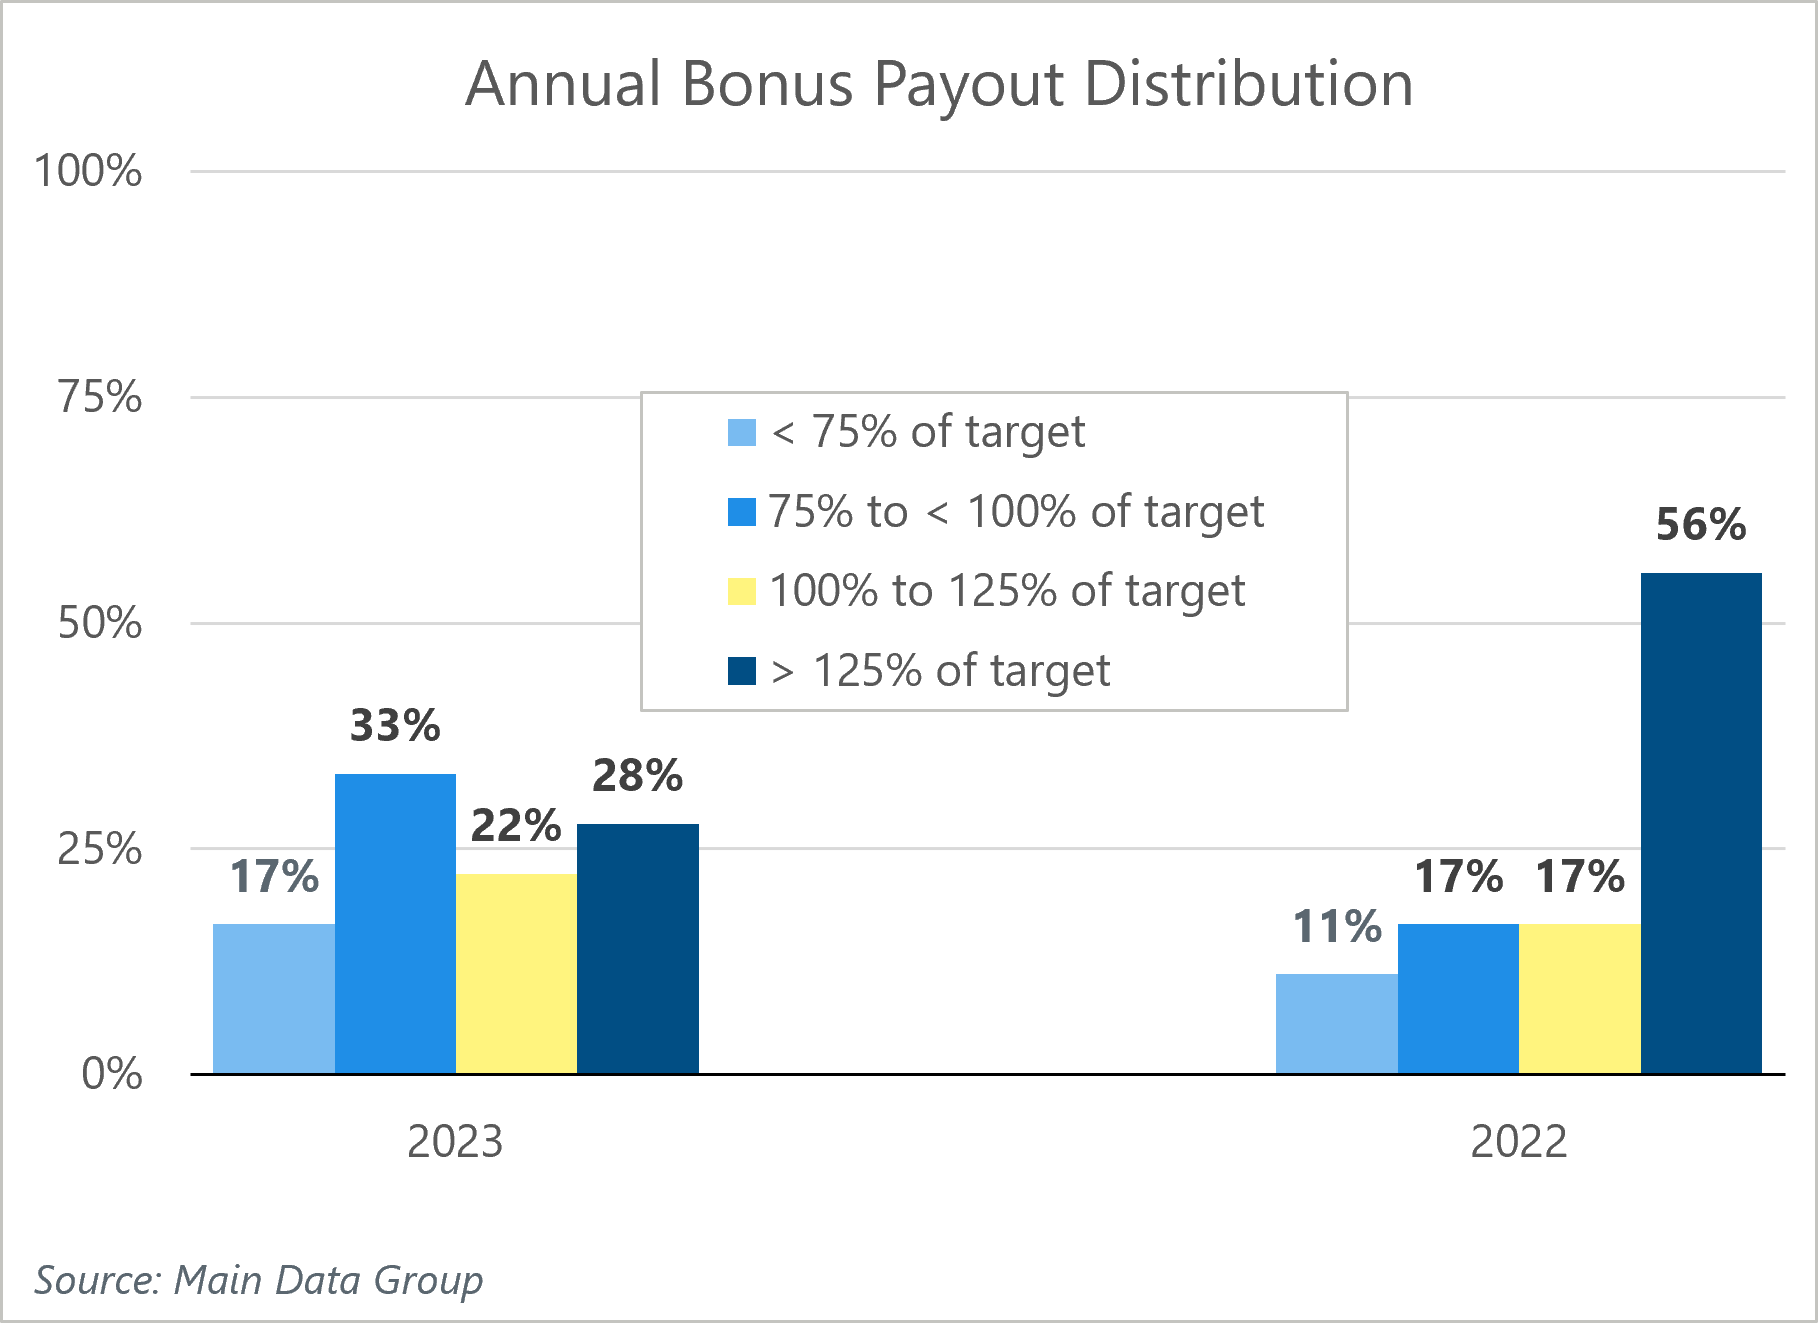
Annual incentive payouts for 2023 performance were distributed around target with a median payout of 100% of target. Payouts declined by approximately 30% compared to 2022 median performance of about 130% of target for this same group. Interestingly, there was an even split between those companies that paid out below target and those that paid out above target. The range of outcomes vary widely with this group, ranging from 74% to 170% of target (excluding two companies with discretionary plans whereby payouts were determined by the compensation committee), with payouts generally trending higher as firm size increases.
For the largest five companies in this group, annual incentive payouts were substantially higher, with a median payout of 140% of target and an increase from last year’s median of 120% of target. Two of the five companies reported decreases in payouts, while only one fell short of target.
Long-term Incentives
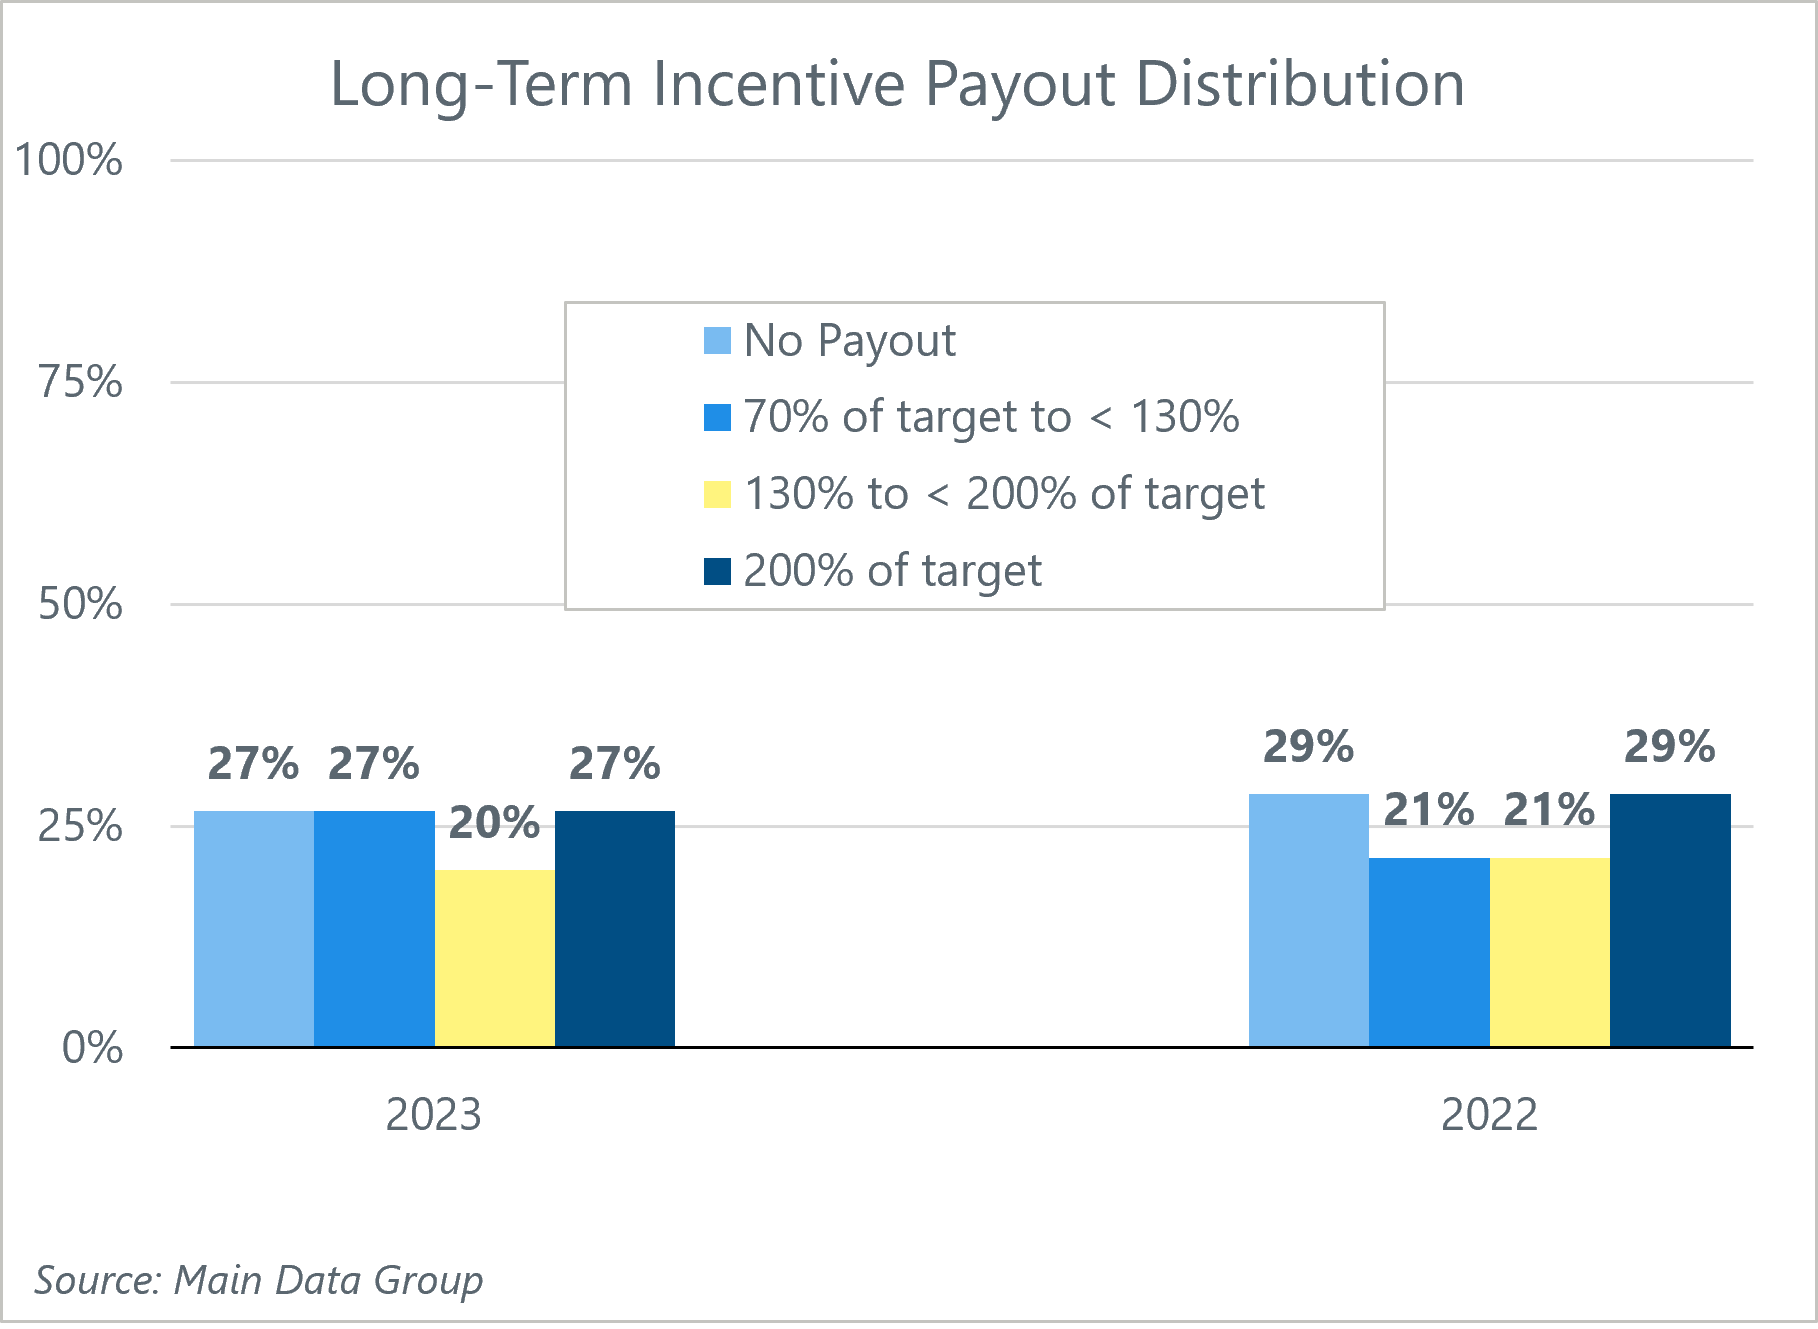
Long-term incentives (LTI) increased, with the median moving up 7.5%. Payouts for LTI plan cycles ending in 2023 generally performed well, with roughly two-thirds of the group paying out above target and a median payout of about 130% of target.
The largest five companies’ long-term incentive values grew at a slower pace than the broader group, with the median increasing 4.5% versus 2022 grant levels. However, LTI plan payouts were at the higher end of the group and paid well above target with a median payout of 178% of target (generally consistent with last year when payouts were around 170% of target).
Conclusion and Outlook for 2024
As companies have transitioned their compensation structures back to pre-COVID norms and adapted to volatile labor markets and the changing landscape around incentive compensation practices, 2024 is likely to be a continuation of minimal compensation changes. This means modest increases to target compensation levels, unless driven by promotions and/or market-based adjustments. Incentive design changes will likely be in the form of tweaks to metrics and weightings to allow for flexibility in a cyclical environment.
Given these trends, we encourage clients to analyze their incentive programs. Taking a hard look at the goal-setting process (stress-testing, reviewing historical results, etc.) and reviewing the link between multi-year compensation and company performance can help ensure the incentive programs are resilient within a volatile market.