
Article | Sep 2025
Biopharma Peer Groups: Data-Driven Insights for Compensation Committees
We sampled 150 biopharma companies to test whether the most common peer group criteria actually correlate with compensation outcomes.

The compensation planning year almost always begins in the same place: defining the peer group. This set of companies provides the lens through which executive and board pay will be evaluated, and it serves as the foundation for benchmarking, incentive design, and compensation decisions. While it is a familiar starting point, it is rarely a straightforward one. No two companies are ever identical, and the process of assembling a comparator group that feels fair and defensible inevitably requires compromise. These trade-offs can create unease for management teams and boards, particularly since the downstream implications for pay levels and practices are not always clear.
In an earlier article, we outlined the framework for building effective peer groups. Here, we move from principles to data, drawing on a sample of approximately 150 small- and mid-cap biopharma companies to test how the most common peer group criteria—financial scope, development stage, therapeutic focus, modality, and geography—actually correlate with compensation outcomes.
For consistency and comparability, our analysis focused on the chief financial officer (CFO) role. The CFO position is useful because it offers a fairly uniform scope of responsibility across companies, disclosure is abundant, and there are relatively few founder-CFOs that might skew results. To further strengthen the quality of the data, we excluded outliers, including zero dollar pay arrangements and one-time new-hire or retention grants that could distort the results.
Understanding correlation is central to interpreting our findings. Correlation measures both the strength and direction of the relationship between two variables. A score of 1 means the variables move together perfectly in the same direction; a score of -1 means they move in exactly opposite directions; and a score of 0 indicates no discernible relationship at all. With that framework in mind, we can examine how certain variables typically used in peer group construction—market capitalization, annual operating expense, cash on the balance sheet, and full-time employee headcount—relate to four core components of pay—base salary, target total cash, equity as a percentage of company, and equity value. The correlations are summarized below:
Pay Component | Market Capitalization | Operating Expense | Cash & Equivalents | # Full-Time Employees |
Base Salary | 0.43 | 0.54 | 0.32 | 0.43 |
Target Total Cash | 0.42 | 0.52 | 0.36 | 0.41 |
Equity % of Company | -0.59 | -0.57 | -0.40 | -0.47 |
Equity Value | 0.70 | 0.49 | 0.28 | 0.38 |
The data confirm a few key points. First, operating expense has the strongest relationship with cash compensation levels, which makes intuitive sense given that employee pay is embedded within operating budgets. Second, market capitalization shows the strongest relationship with equity, with a positive correlation to grant values and a strong inverse relationship to share percentages. Third, other factors—such as headcount and cash on the balance sheet—are also correlative, but to a lesser degree. Among them, headcount appears more consistent as an indicator than cash and equivalents.
But what about qualitative factors such as development stage, which many boards and management teams see as central to identifying appropriate peers? Here, the results were particularly interesting:
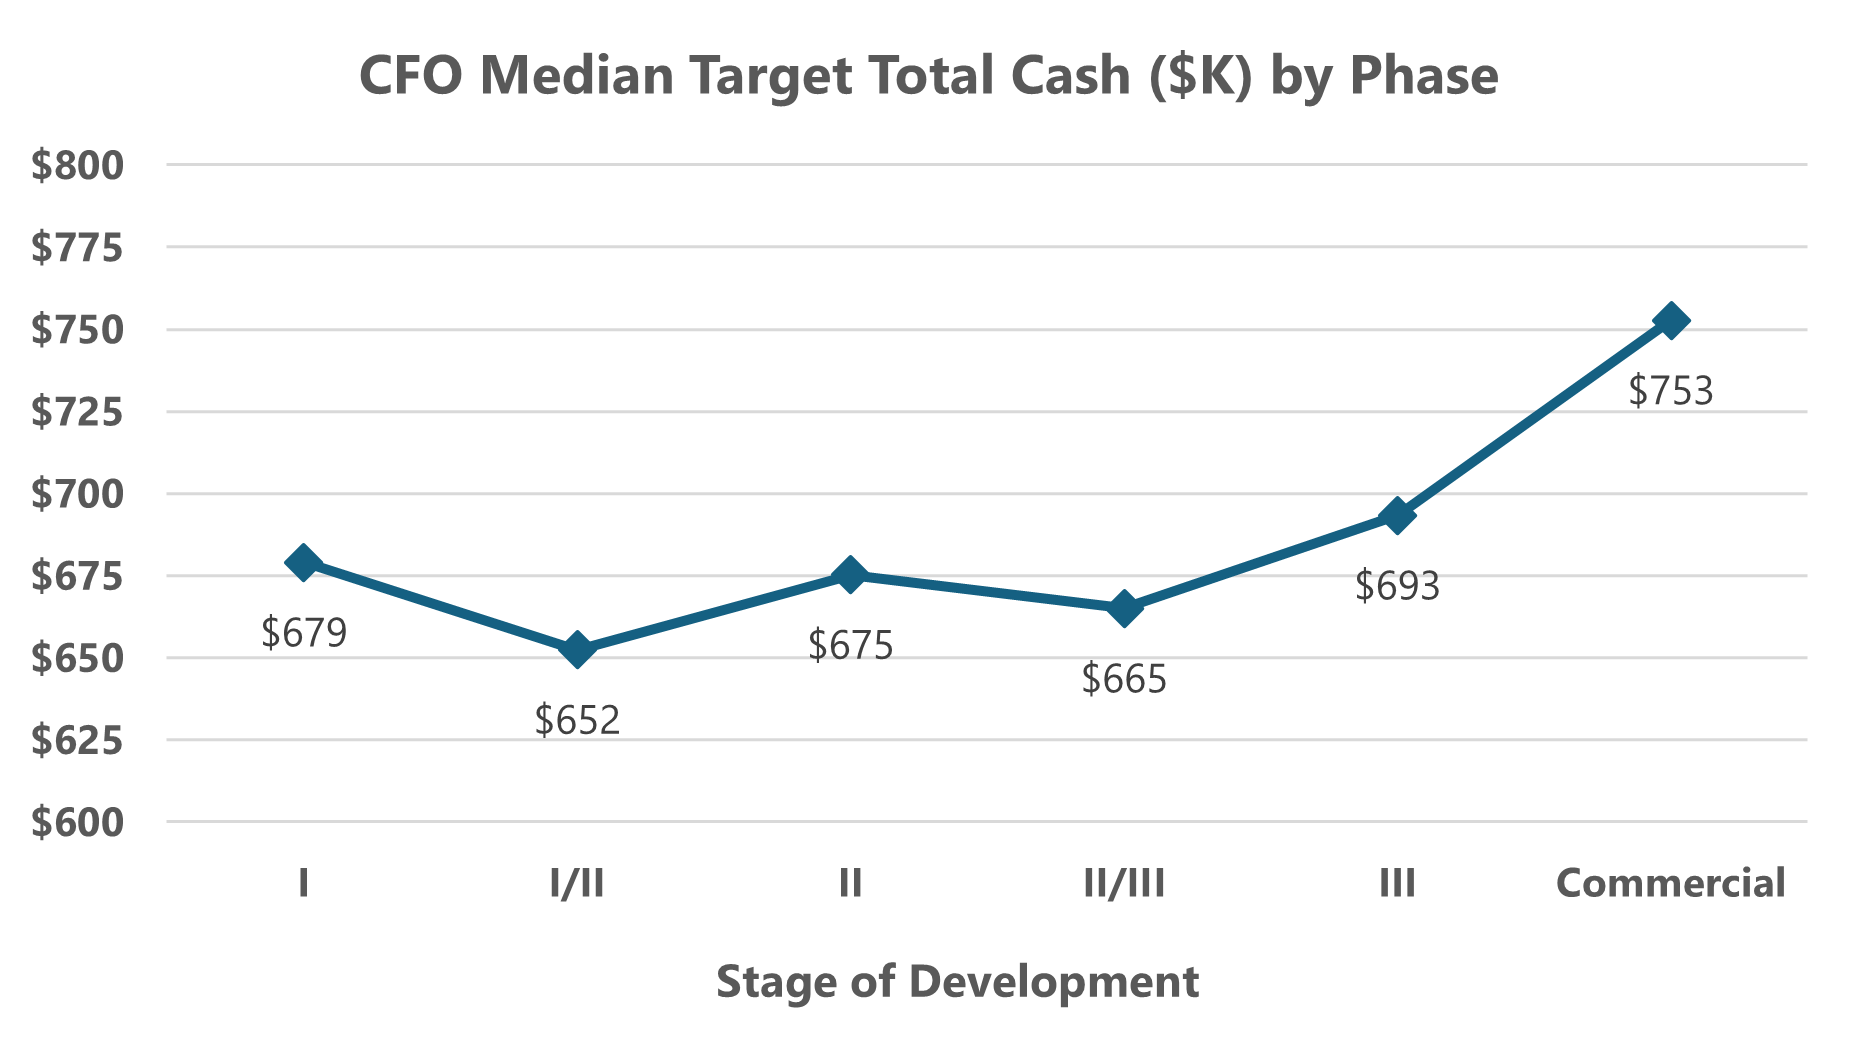
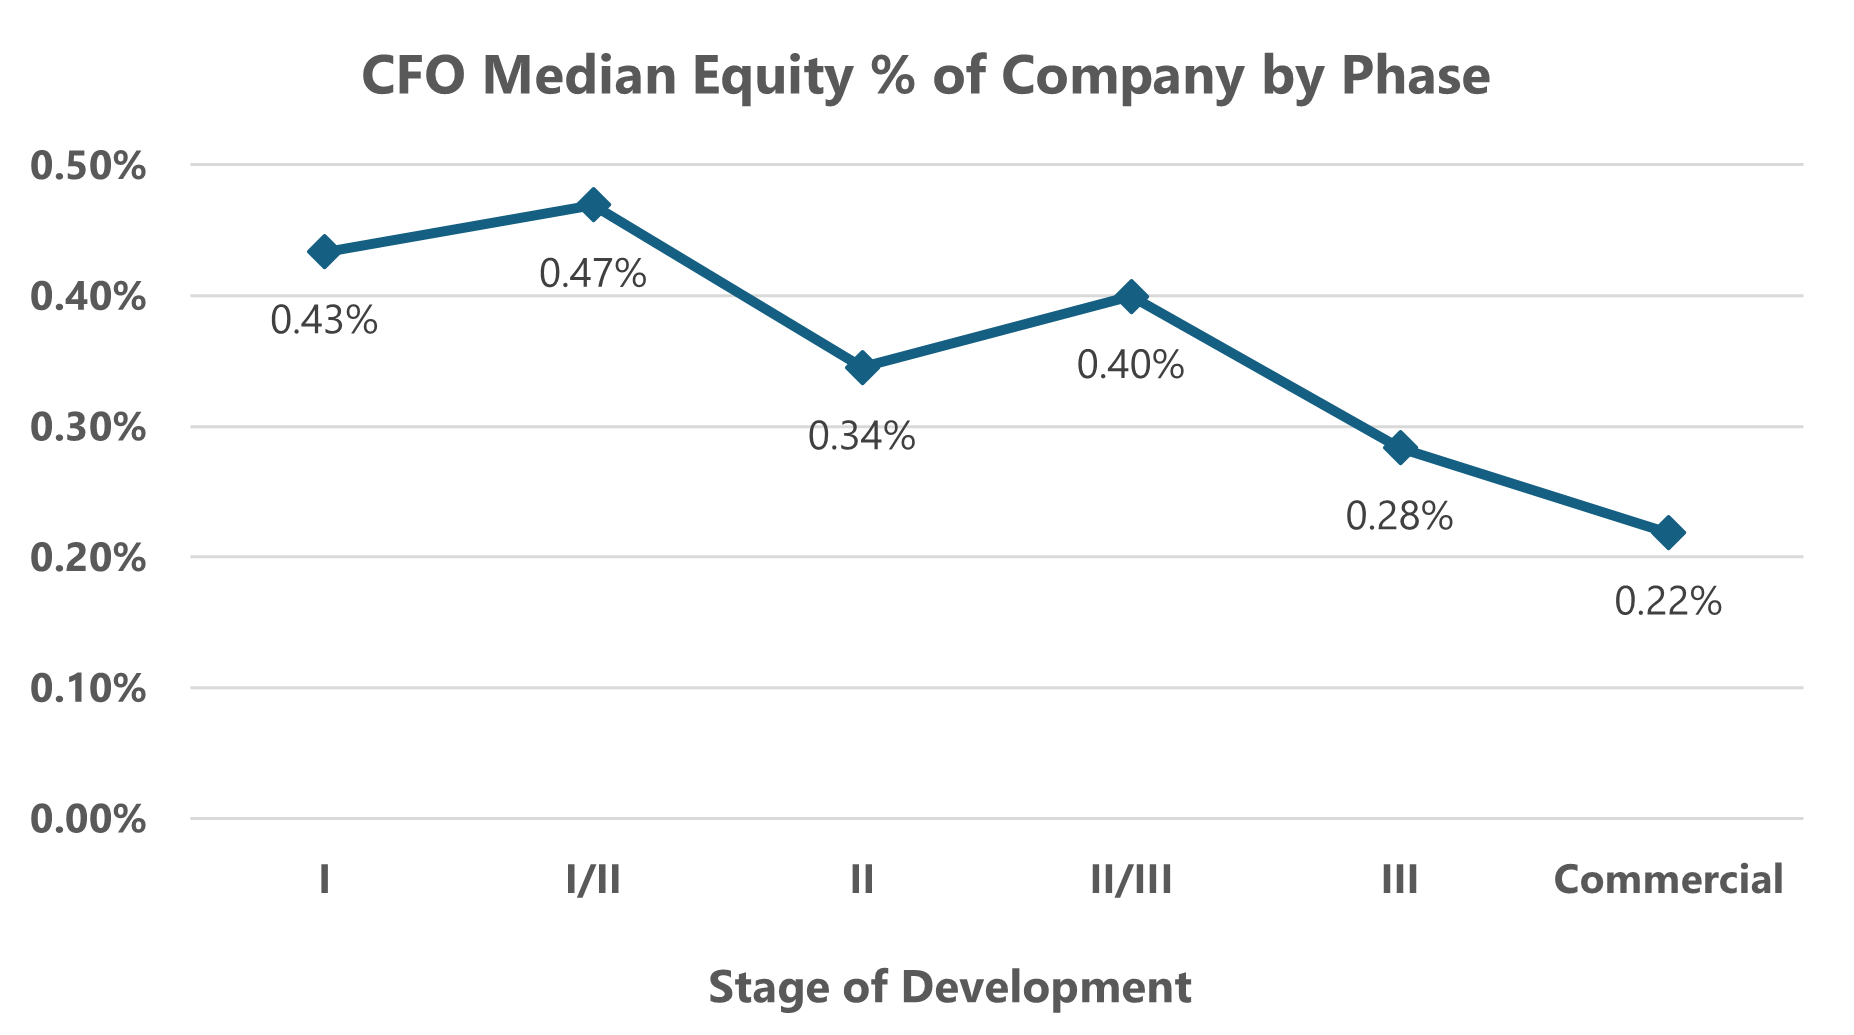
Across Phases I through II/III, cash compensation levels did not appear especially sensitive to development stage; they moved within a fairly narrow range. Equity award sizes followed a similar pattern, with only a modest downward trend as companies advanced. The bigger changes occurred at Phase III and into commercialization. At these points, we observed a noticeable step-up in cash compensation, coupled with reductions in equity on a percentage of company basis. Equity values (not shown above) continued to increase with stage progression, consistent with generally increasing market valuations.
We also tested compensation levels against therapeutic area, modality, and geography. In each case, the results were mixed, and no consistent or quantifiable trends emerged across the dataset. For instance, while many expect oncology or cell and gene therapy companies to pay more, the data did not confirm this in any reliable way. Likewise, while California-based companies appeared to offer higher cash pay, this was generally offset by lower equity percentages, suggesting that differences could be attributable to pay mix rather than pay levels. None of this is to say that trends don’t exist based on therapeutic area, modality, and geography, but rather that the variance within our dataset was greater than any systematic differences we could attribute to these factors.
Implications for Compensation Committees
For compensation committees, several practical takeaways emerge from this analysis. Market capitalization and operating expense appear statistically most impactful in shaping peer compensation benchmarks, though other factors also matter. Taken together, they reflect the underlying scale and complexity of executive roles and drive the pay market. Beyond that, clarity on equity strategy is essential. Pre-commercial companies that grant equity as a percentage of company should be cautious about overloading peer groups with larger market cap companies, since this can skew benchmarks upward on cash compensation and downward on equity percentages, creating a picture that doesn’t reflect the company’s true stage or risk profile. By contrast, commercial and near-commercial companies, where equity value is more often considered, will find that larger market cap peers raise both cash and equity benchmarks, with clear implications for dilution and burn rates. While it can be tempting to add so-called aspirational peers or “shining cities on the hill,” doing so can be counterproductive.
Stage of development, while important, offers some flexibility. Within the pre-commercial spectrum, peers from Phase I through III are generally usable, but committees should recognize the modest uptick in pay levels around Phase III and the more material changes that occur at commercialization. Therapeutic comparability is always helpful for context and credibility with stakeholders, but our data suggest it is not a consistent driver of pay levels. Geography, meanwhile, is perhaps more of a tie-breaker: useful when choosing between two otherwise comparable peers, but not something that should dominate peer selection.
Most importantly, committees should resist the temptation to chase the “perfect” peer group as there is no such thing. What matters is that the set, taken together, provides a reasonable reflection of the company’s size, stage, and complexity. Understanding where outliers might influence the data and adjusting expectations accordingly is far more valuable than aiming for a level of precision that doesn’t exist. Compensation benchmarking will always involve judgment; but with a clearer view of how different factors influence outcomes, committees can make those judgments with confidence, building peer groups that may not be flawless, but are sound, defensible, and ultimately fit for purpose.