Article | Dec 2025
Emerging 2026 Incentive Design Trends in the Oil and Gas Sector
Insights and projections based on data from 84 representative companies.

Introduction
Based on an analysis of 84 US public company filings through 2025 that represent two of the larger oil and gas subsectors–oilfield services (OFS) and exploration and production (E&P)–we find significant executive incentive plan takeaways. Below, we offer a look at current trends as well as key differences between the two sub-sectors and their respective outlooks for 2026. These trends have direct implications for how boards set metrics, balance financial and non-financial priorities, and calibrate performance curves for 2026.
Annual Incentive Plan Design: Number and Types of Metrics
One of the areas where we see contrast between oil and gas sectors is in the number of annual incentive plan criteria that are used to evaluate performance. OFS firms generally incorporate more streamlined plans, with 73% reporting four or fewer performance metrics.
OFS: Prevalence of Annual Incentive Metrics
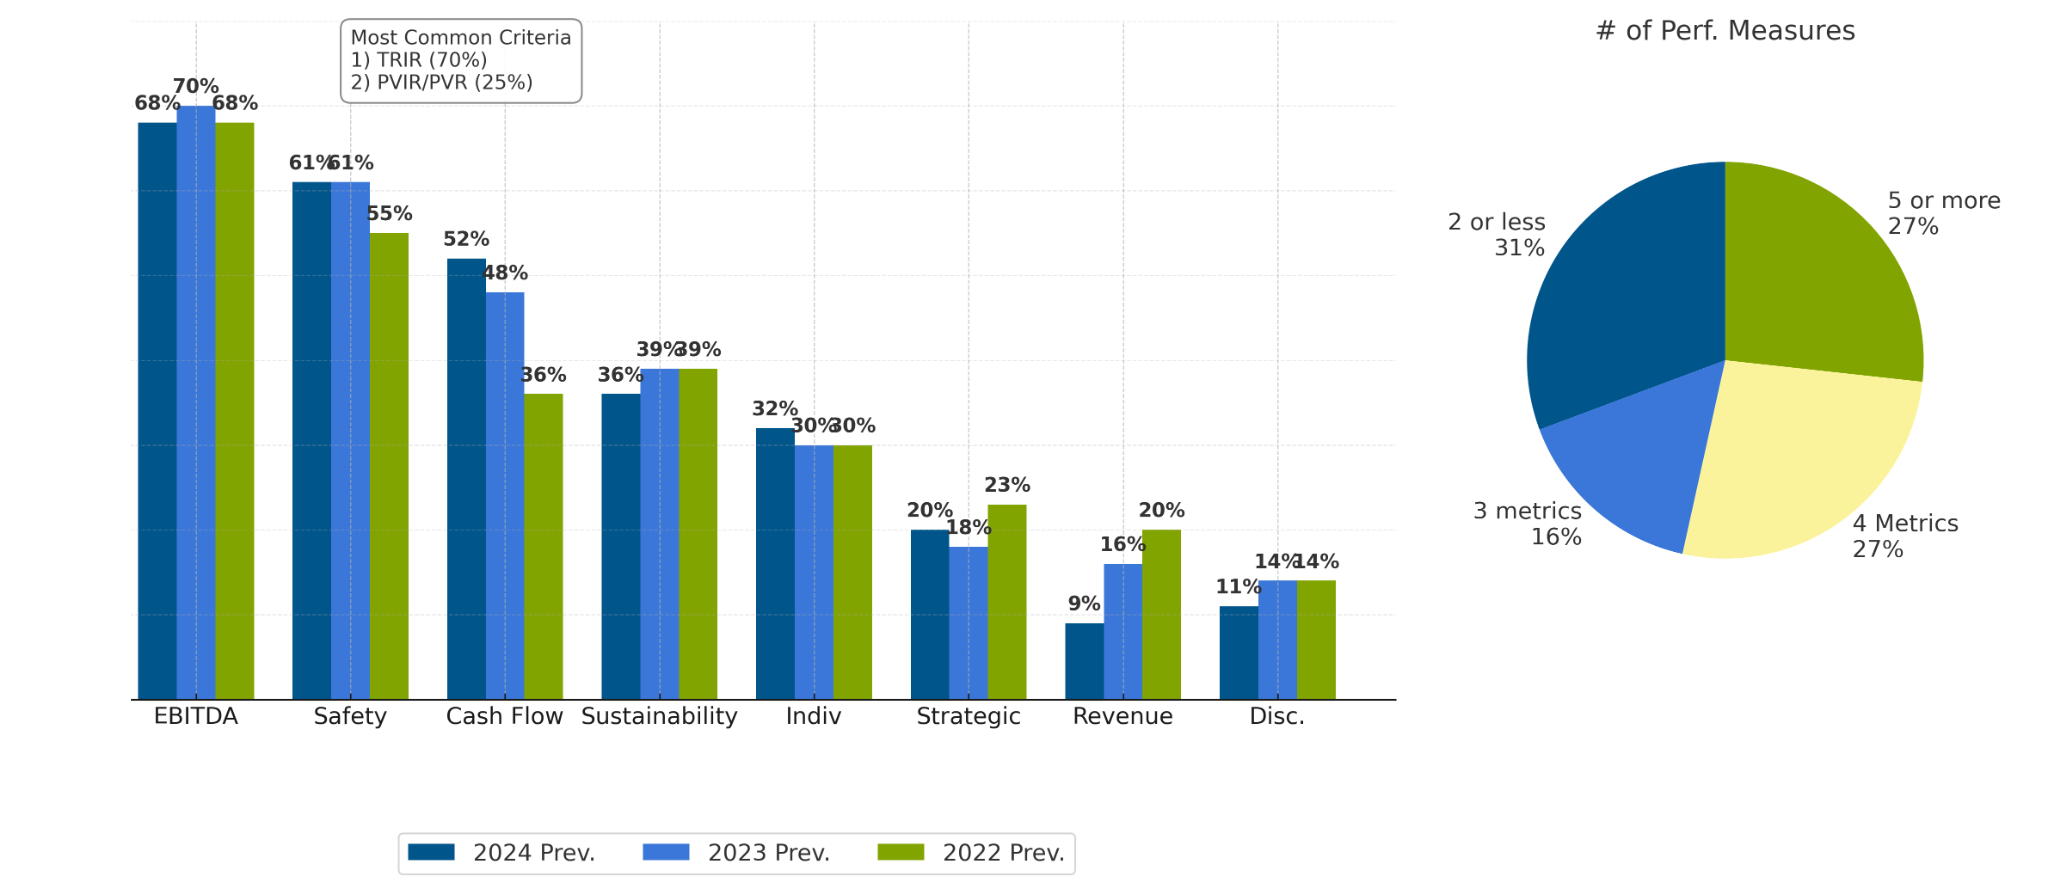
EBITDA (earnings before interest, taxes, depreciation, and amortization) and cash flow are considerably more prevalent than other financial measures, with 68% and 52%, respectively, reporting the use of these measures. Over the three-year cycle from 2022-2024, we see increases in the prevalence of cash flow metrics (36% to 52%), reflecting the overarching emphasis on generating positive operating and/or free cash flow, and a decline in the use of revenue as it has become less strategic and, perhaps, less predictable. Safety and other sustainability-related goals continue to be prevalent within these plans, with the prevalence of safety metrics stabilizing at 61% and sustainability goals decreasing slightly to 36%.
E&P firms, on the other hand, take a more comprehensive, basket-of-measures approach to annual incentives, with 68% of firms using at least six performance metrics. This is usually because E&P firms focus more on cost control and do so by isolating various cost inputs such as finding and development costs, general and administrative expenses, and operating expenses. E&P firms also tend to incorporate more strategic and operational measures such as production goals and the execution of project milestones. Over this three-year cycle, we see a significant return to the use of production measures, with prevalence increasing from 39% to 52% over the cycle.
E&P Prevalence of Annual Incentive Metrics
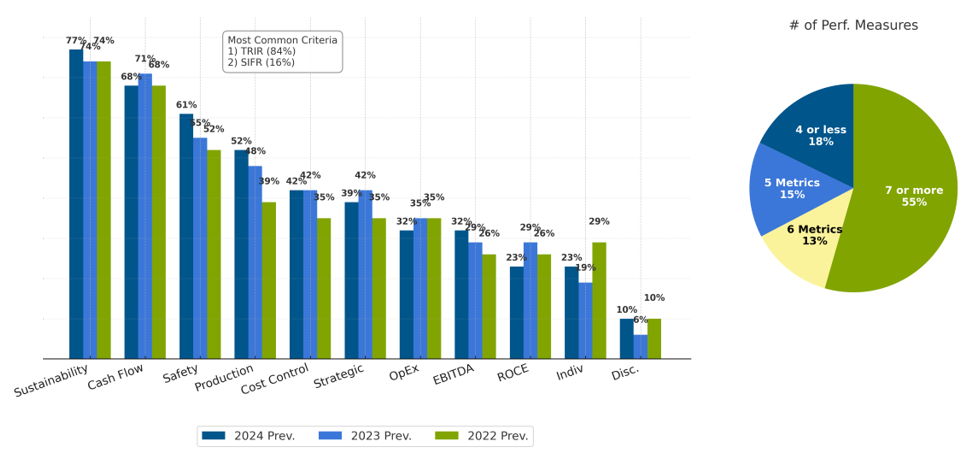
Cash flow measures are the most utilized financial criteria, followed by various cost control metrics, operating expenses (OpEx), and EBITDA. Non-financial measures like sustainability, safety, production, and strategic goals are each used by at least ~40% of the E&P firms in the group.
OFS plans are simpler and more cash-flow/safety-oriented, while E&P plans are more metric-dense and cost/production heavy. Even so, boards should align their metric complexity with business model complexity rather than simply replicating sub-sector norms.
Long-Term Incentive Plan Design: Number and Types of Metrics
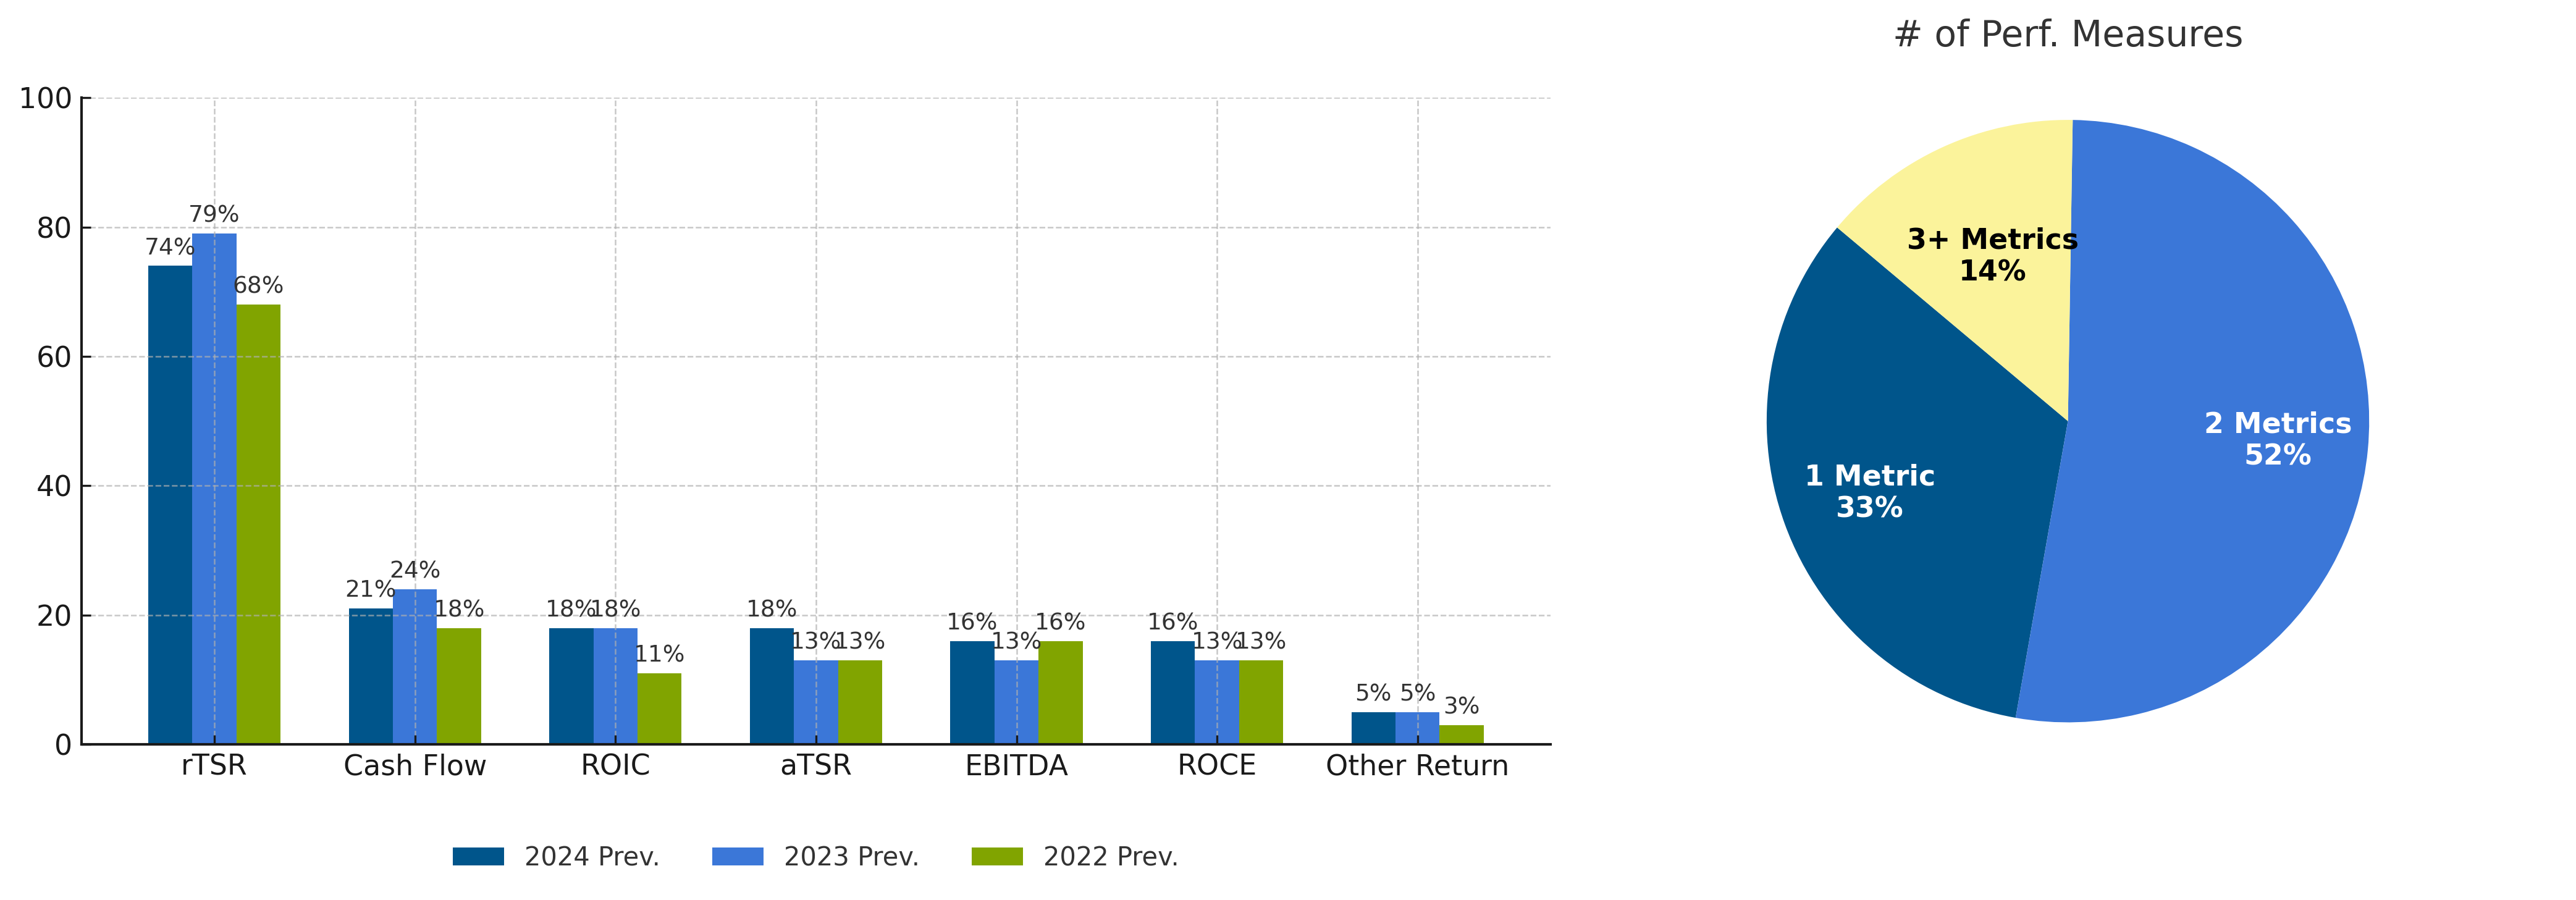
Total shareholder return (TSR) continues to be the most-utilized long-term performance measure across all oil and gas subsectors, and we see both relative TSR (rTSR) and absolute TSR (aTSR) metrics being used. The preference of these metrics from shareholders and compensation committees tends to lead to a heavier weighting (roughly 70-80% of plan total for OFS and E&P firms, on average). As shown below for both OFS and E&P firms, more than 80% of firms studied use two or fewer performance metrics in their long-term incentive (LTI) plans.
Outside of TSR measures, the two subsectors use similar performance criteria, but with a few key differences: OFS firms, as shown below, apply a heavier emphasis on return-based metrics like return on invested capital (ROIC) and/or return on capital employed (ROCE), with roughly 39% of the subsector using some form of returns in determining long-term incentive payouts.
OFS: Prevalence of Long-Term Incentive Metrics
E&P firms, while still incorporating return-based metrics in many cases, have doubled-down on TSR in the last couple of years. As shown below, while ROIC and ROCE are still prevalent, E&P companies have begun incorporating absolute TSR into their plans as a compliment to relative TSR and we see the beginnings of this same trend within the OFS sub-sector.
E&P: Prevalence of Long-Term Incentive Metrics
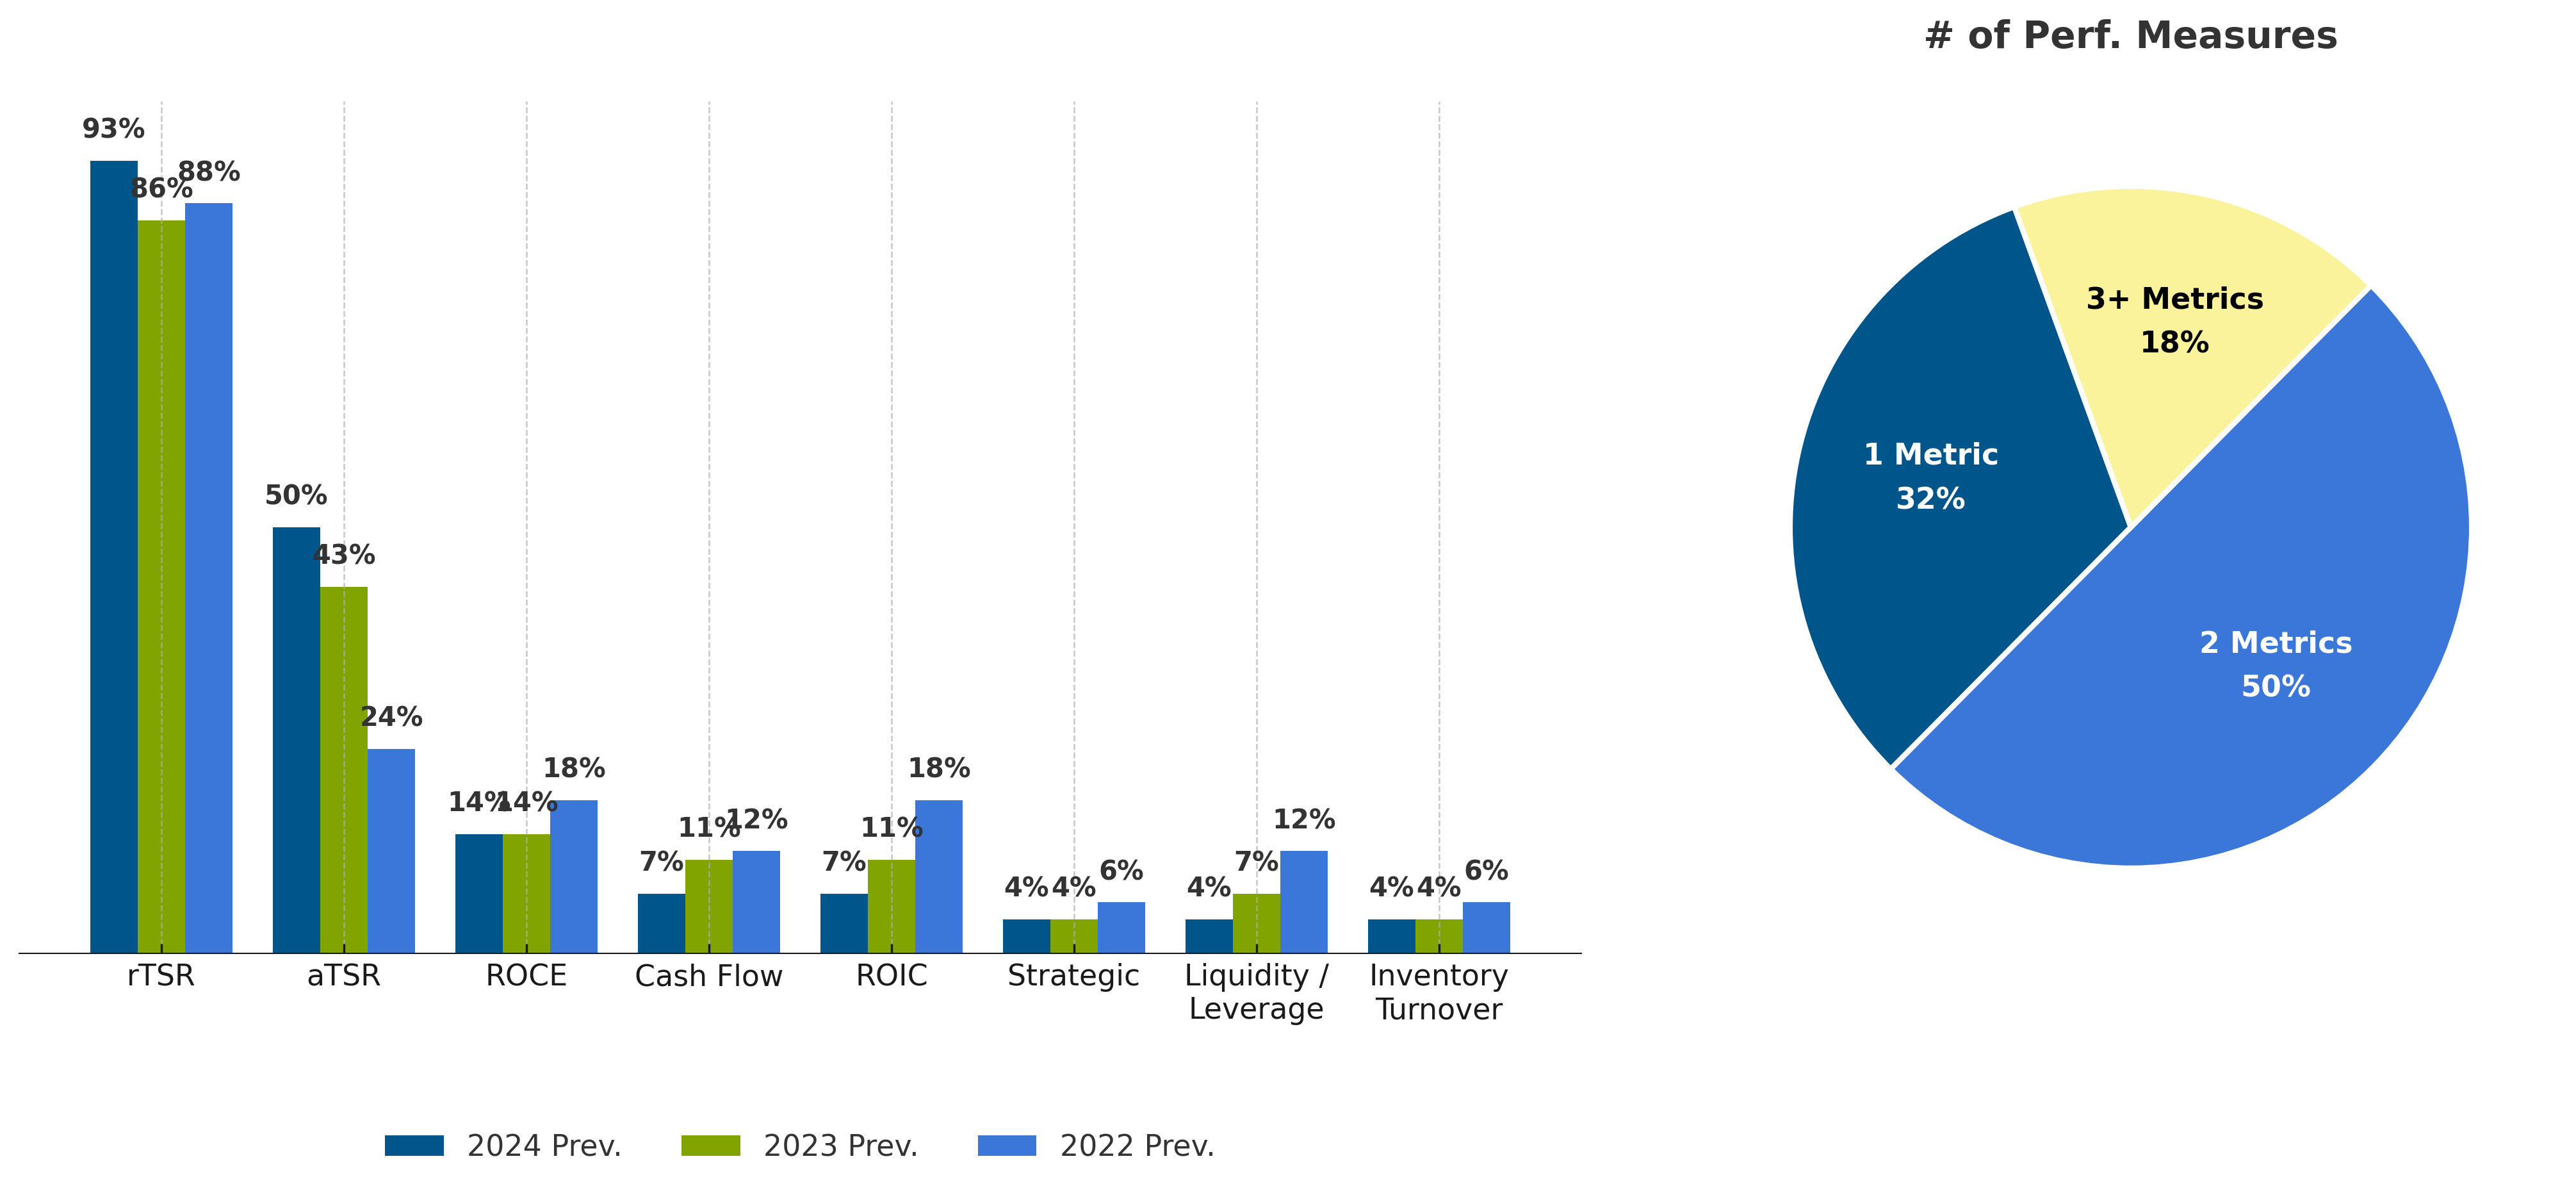
OFS firms emphasize returns (ROIC/ROCE) more heavily, whereas E&P has doubled down on TSR, increasingly blending relative and absolute TSR.
Outlook for Fiscal Year 2026
In line with historical norms, we do not expect to see dramatic changes in incentive plan design going into 2026. “ESG”-related terminology and many corresponding goals have been removed from incentive plans, with safety and some “sustainability”-related goals remaining. Both OFS and E&P firms will take a hard look at goal setting for all of their metrics, as ongoing uncertainty continues both from a macroeconomic perspective and, more specifically, around the supply and demand for oil and gas, along with the appetite, or lack thereof, for continuing investments in oil and gas projects.
Companies should review performance expectations and align levels for their performance and corresponding payouts and consider, in many cases, reducing threshold performance requirements to mitigate some of this risk of falling below the performance threshold. On top of the standard market factors, the global economic and tariff environment contributes to increase variability of an already variable industry.
Summarized Actions to Take:
- Stress-test incentive plan goals under multiple commodity-price scenarios.
- Revisit threshold performance levels to avoid all-or-nothing outcomes in a volatile environment.
- Confirm that sustainability and safety metrics are clearly defined and auditable, even if “ESG” wording is toned down.
- Evaluate whether absolute TSR is appropriate as a complement to relative TSR, especially where investors are focused on investment returns.