
Article | Mar 2026
Rethinking Effective Performance Peer Groups in Today’s Oil & Gas Sector
As oil and gas peer groups continue to shrink, relative performance frameworks require a more thoughtful design process.

The oil and gas industry is navigating a sustained wave of consolidation, and the effects are increasingly visible in compensation committee meetings. Mergers and acquisitions, bankruptcies, and privatizations over the last several years have materially reduced the number of viable public comparators. For many companies, peer groups that once included a dozen or more companies now contain only a handful—in some cases, five or fewer viable public peers.
Traditional advice focuses on expanding peer groups into other industries. However, companies should focus on the harder (but more relevant) challenge: How to maintain an effective relative performance incentive plan framework with the most relevant comparators, even when the peer group becomes smaller. To be clear, that does not suggest retroactively changing the peer group for outstanding awards, which would raise obvious governance concerns.
The challenge is forward-looking: What should the oil and gas performance peer group look like for the next cycle of long-term incentives?
Why Shrinking Peer Groups Are Especially Challenging in Oil and Gas
Relative total shareholder return (TSR) is a widely used performance metric because it reflects how the market values execution amid macroeconomic forces. But the framework behaves differently when the peer group contracts, particularly in a commodity-driven industry like oil and gas. Three dynamics matter most.
High Sector Correlation
Oil and gas equities tend to move together in response to changes in commodity prices. When the peer universe shrinks, performance clusters more tightly, and even small differences in TSR can drive disproportionately large ranking movements.
Divergent Business Models
Even among upstream companies, no two portfolios look alike. Differences in commodity mix and basin exposure for E&Ps, or rig counts and service mix for oilfield services, can materially affect TSR. With fewer peers to absorb these variations, relative performance comparisons become noisier and less intuitive.
Ranking Instability in Small Groups
Percentile-based TSR designs rely on having enough companies to generate a stable distribution. With only five or six peers, each company represents a large portion of the ranking curve. In a six-company peer group, each ranking position effectively represents roughly 20% of the distribution. Small TSR movements can therefore trigger outsized payout swings. A two-point TSR shift can easily move a company from a median outcome to the lower end of the distribution, or vice versa. Committees rightly question whether such results reflect meaningful differences in performance.
Two Sensible Paths Forward
In practice, companies confronted with a shrinking peer group usually gravitate toward one of two approaches. Both can work; they simply reflect different priorities and philosophies about performance measurement. The following graphs demonstrate theoretical examples of these two different approaches.
Approach 1: Keep an Industry-Pure Peer Group and Modernize the Design (Company A)
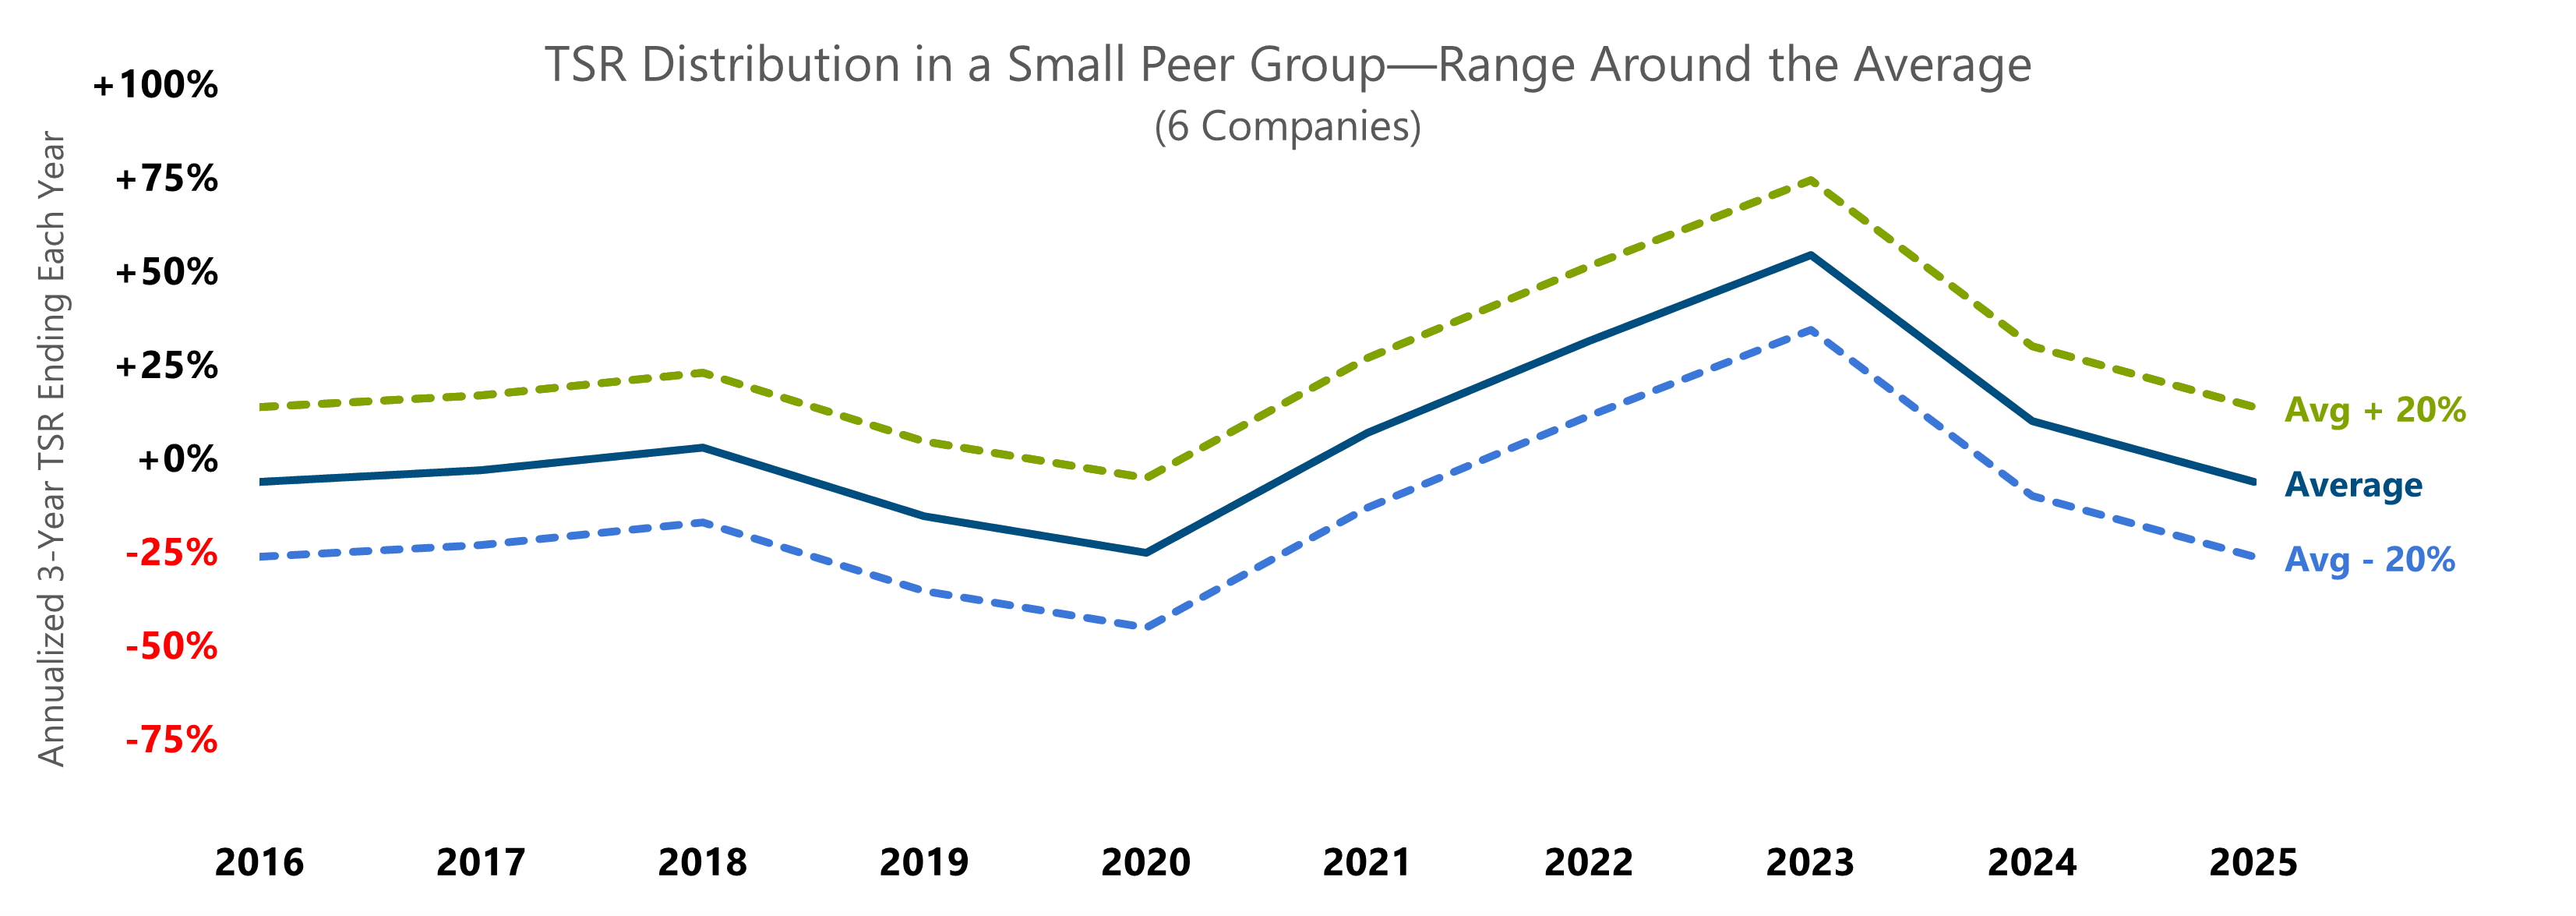
Company A determines that staying with its direct competitors produces the most meaningful performance comparisons. It retains the six surviving peers but shifts away from a ranking-based design to avoid volatility.
Instead, Company A adopts a weighted-average outperformance model, which compares the company’s TSR to the average TSR of the peer group rather than its ordinal position. This structure produces a more stable and intuitive payout curve. Key features include:
- Target payout at the peer average, which better reflects true relative performance in a small sample.
- A linear slope; for example, ±5% payout for each ±1% difference in TSR, eliminating the cliff effects inherent in small ranking groups.
- A reduced maximum payout in negative TSR periods, such as lowering the cap from 200% to 175%, acknowledging the shareholder experience.
This approach preserves the integrity of an industry-pure peer set while ensuring the incentive design behaves reasonably in a reduced-peer environment.
Approach 2: Expand the Peer Group and Preserve the Traditional Framework (Company B)
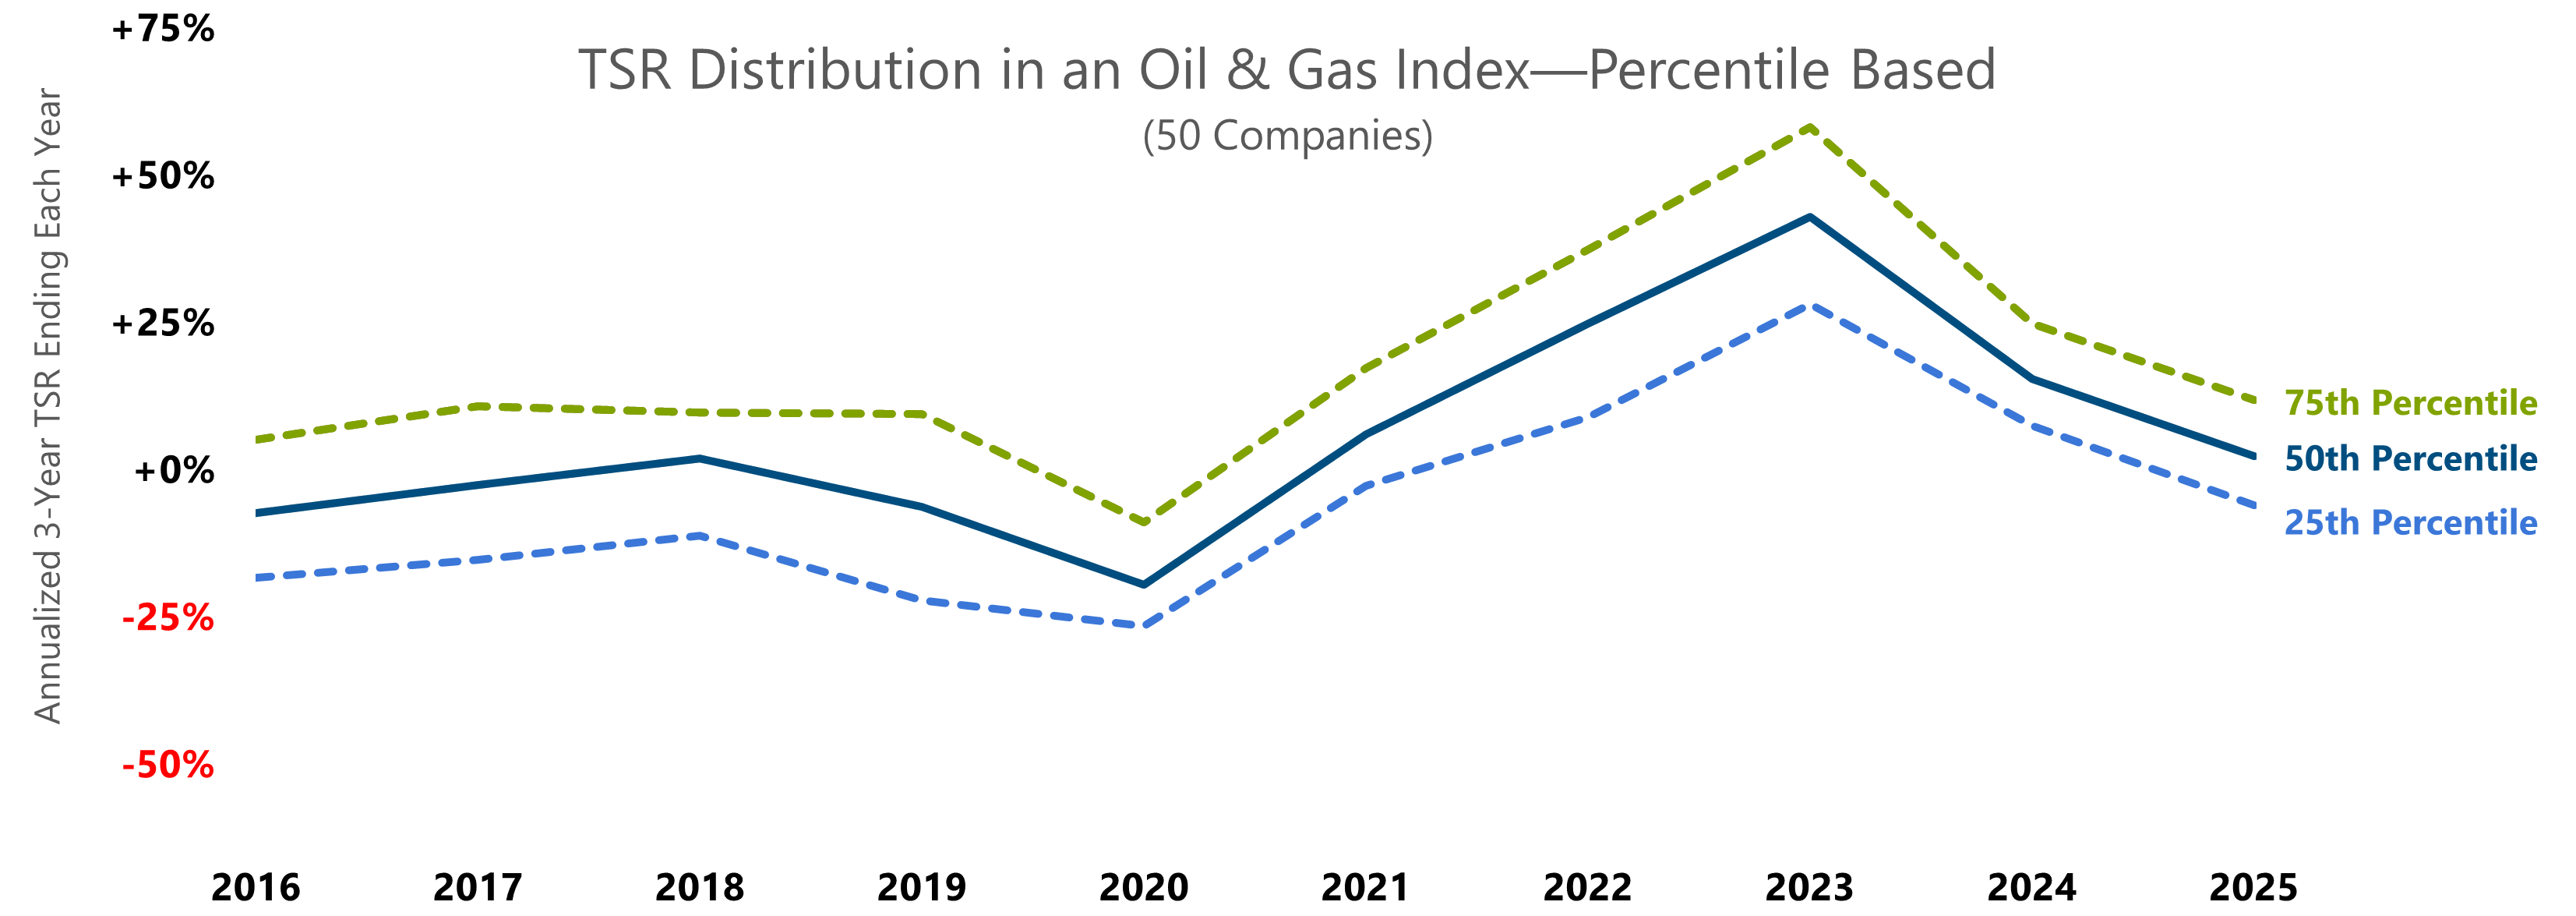
Company B takes a different path. Its committee values the familiarity and external understanding of a ranking or percentile-based TSR plan. To support that design, it selects a broad oil and gas sector index that includes companies outside of its peer universe but with sufficiently similar economic or correlation profiles.
The goal is to expand the peer group to a large sample size, enough to support a stable percentile distribution without fundamentally changing the TSR construct.
However, this approach carries a notable risk. Expanding the peer group solely to achieve critical mass can introduce unintended consequences. It happens frequently when companies import peers from different sub-industries or broader market indexes such as the S&P 500 simply to fill out the peer group. Because these companies often move for reasons unrelated to commodity cycles, they often anchor the extreme ends of the TSR distribution. Depending on where the oil and gas cycle is, at the beginning or end of the measurement period, these non-correlated peers may consistently show up as either the highest performers or the lowest performers. The result is a peer group that is larger, but not necessarily more meaningful, and one that can introduce distortions that are harder for a committee to justify.
Company B can mitigate these risks through correlation testing and disciplined peer screening, but it can also introduce structural safeguards within the plan design itself. For example, the committee may designate a small subset of true competitors, perhaps two key peers, and incorporate performance guardrails tied specifically to them. If Company B outperforms those core competitors, the plan could provide a minimum payout of 75% of target, regardless of where the broader peer distribution falls. Conversely, if Company B underperforms those same competitors, the maximum payout could be capped at 150% of target.
This type of overlay preserves the statistical benefits of a larger peer group while ensuring that performance relative to the company’s most relevant competitors ultimately anchors the outcome. In a consolidating industry, that balance between breadth and competitive accountability can be critical.
Deciding the Best Approach
Shrinking peer groups are not a reason to abandon relative performance metrics. They require a more deliberate approach to defining comparability and designing the incentive structure. As consolidation reshapes the sector, companies will increasingly face the choice between maintaining an industry-pure peer group and updating the TSR methodology, or expanding thoughtfully into adjacent areas to preserve a more traditional structure.
Whether a company aligns more naturally with Company A or Company B, the objective remains the same: to establish a performance framework that fairly reflects the realities of a cyclical industry and provides meaningful long-term alignment between executives and shareholders.
Consolidation has reduced the number of peers, but not the need for disciplined design. In a shrinking sector, a performance plan’s credibility does not depend on the size of the peer group, but whether its structure produces outcomes that board members can defend.