
Advisor Blog | Jun 2024
E&P Executive Compensation: 2024 Proxy Season Data
Exploration and production (E&P) has grown at a greater rate than many other oil and gas industry subsectors; here’s how that has impacted CEO pay.

Introduction
Over the last three years, the oil and gas industry has experienced financial and operational success, evidenced by historic profit levels and strong shareholder returns. This boom, however, has been more evident in certain subsectors. Exploration and production (E&P), for example, has seen tremendous growth throughout the COVID recovery era. Since December 2020, the S&P Exploration and Production Index has increased in value at a greater rate than the equipment and services, storage and transportation, and integrated oil and gas indices.
Based on early filings from the E&P sector, we summarize the effect of the sector’s notably strong performance on constituent CEO compensation. We have reviewed 2023 compensation data for a group consisting of 16 E&P firms with revenues ranging from approximately $50 million to $60 billion over the last twelve months and compared the findings to 2022 disclosures from the same companies. Topics covered include:
- Base salary changes
- Annual and long-term incentive trends (target and actual payout); and
- Performance of larger industry players versus the broader E&P sector.
We also analyzed a subset of the aforementioned 16-company group consisting of the five largest constituents. These firms have a median revenue of $11.2 billion over the last twelve months and a median market cap of $44.1 billion as of December 31, 2023.
Base Salaries
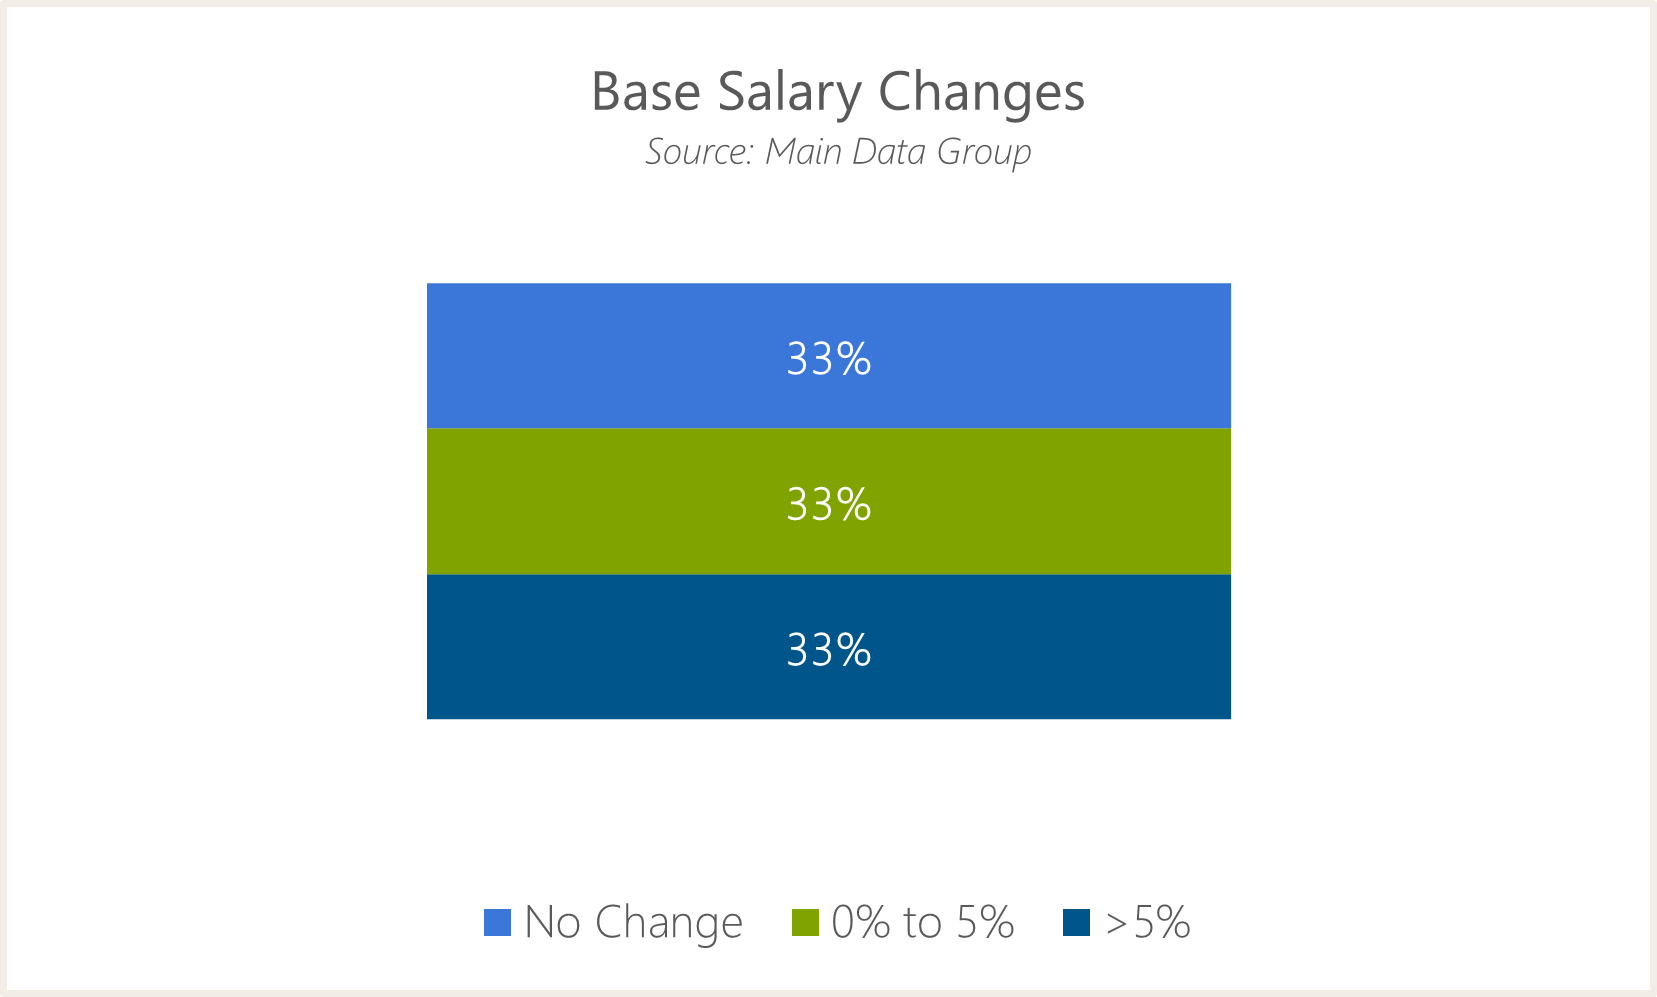
In accordance with historical trends, CEO base salaries increased roughly 3% at median. One-third experienced no change, one-third grew more than 5%, and the final third approximated the broader group median.
It should be noted that 80% of those with no change in base salary have a tenure of at least eight years while all indivduals experiencing an increase of more than 5% have held their current position for less than five years. This aligns with the general industry practice of “growing” into CEO compensation and plateauing guaranteed pay as tenure increases.
We also analyzed a subset of the aforementioned 16-company group consisting of the five largest constituents. These firms have a median revenue of $11.2 billion over the last twelve months and a median market cap of $44.1 billion as of December 31, 2023. This subset had a median of 3% growth in base salary, which is in line with the broader group median.
Annual Incentives
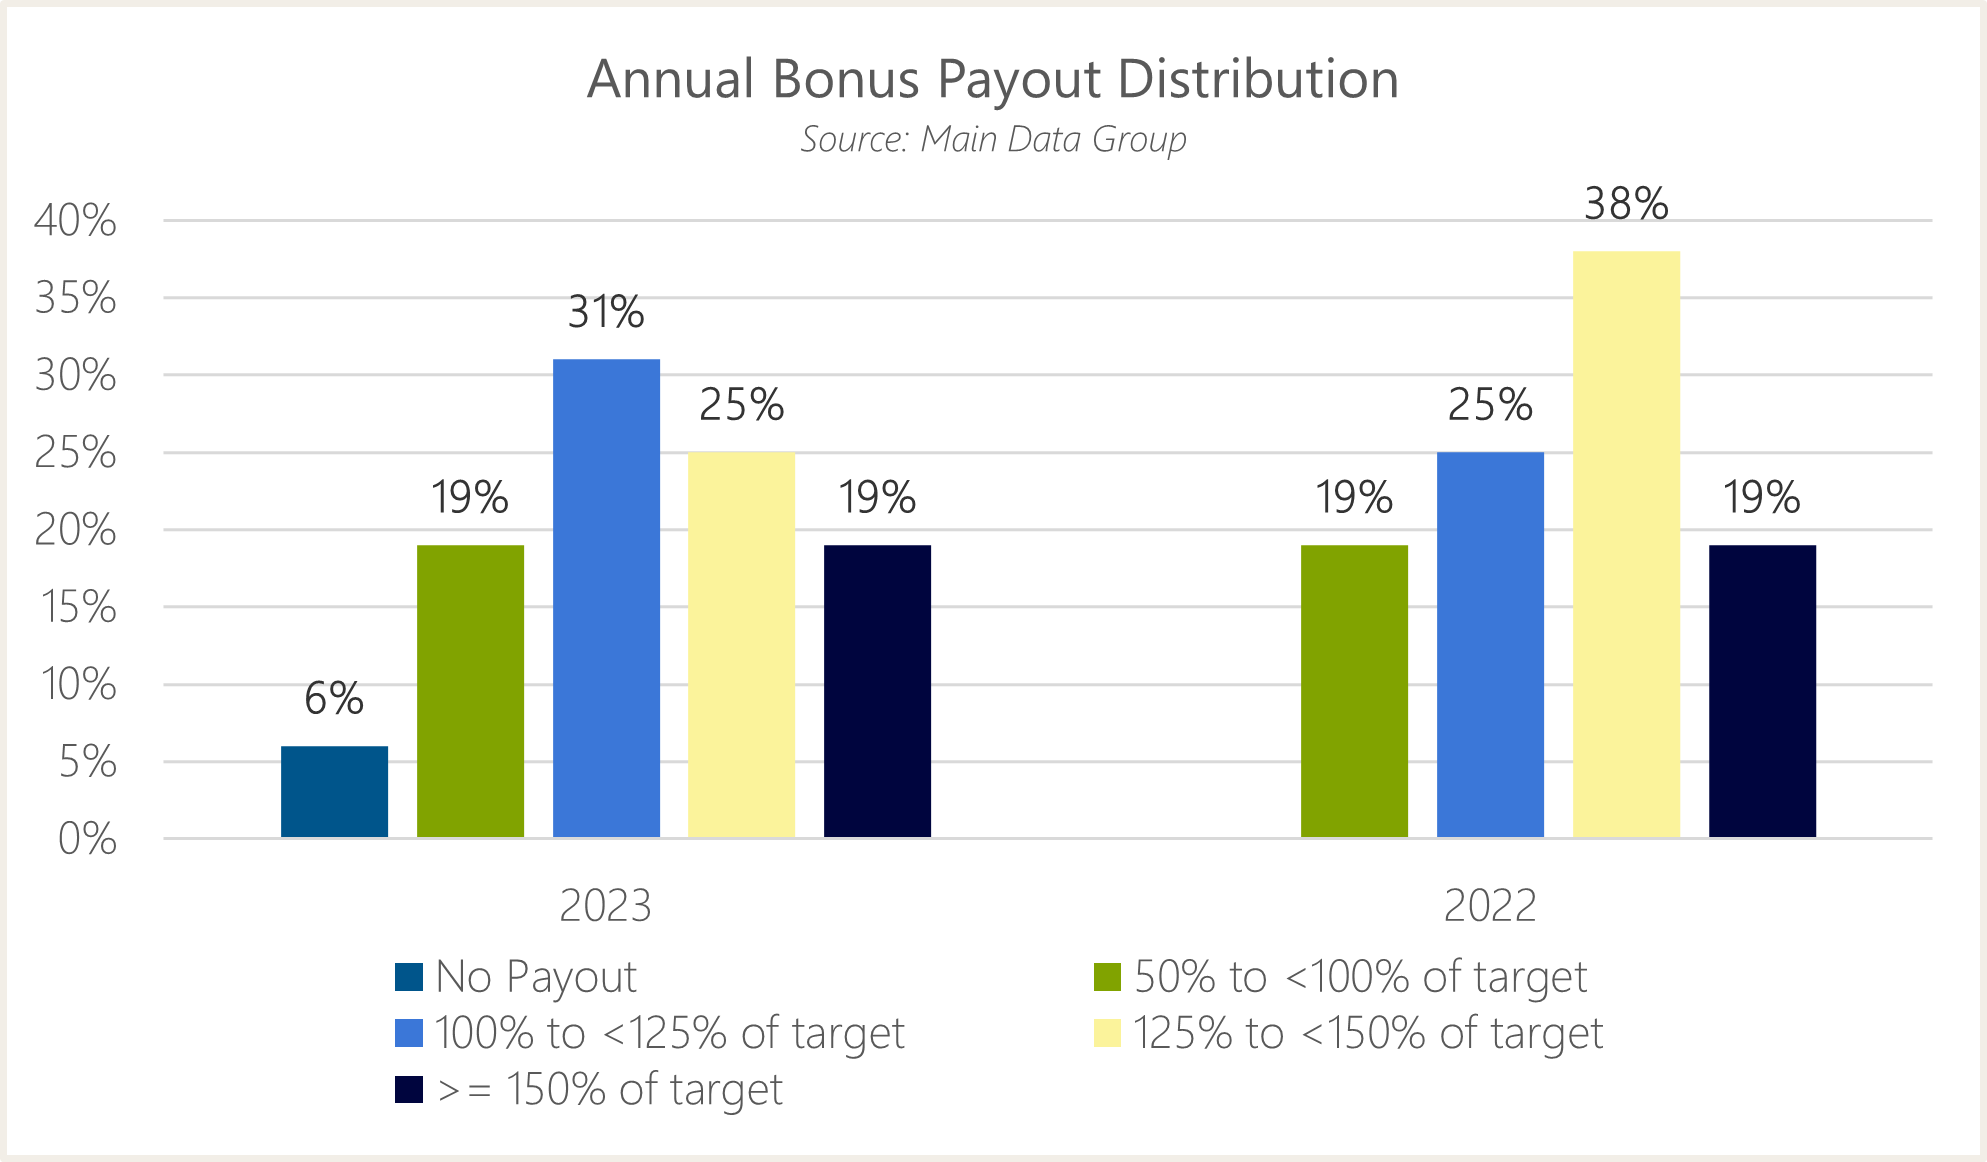
At 109%, annual incentive payouts made during 2023 were mostly above target, but lower than 2022 payouts (132%). While only 13% of the companies studied paid out below target in both 2022 and 2023, the lowest 25% of payouts shifted notably from 92% of target in 2022 to 64% of target in 2023, due primarily to one organization with a 0% payout.
Payouts were considerably higher for the five largest companies in the group, ranging from 130% to 188% of target. Contrary to the fluctuations in base salary and the annual incentive results from a majority of the group, year-over-year performance improved for the top five firms, with median bonus payouts increasing to 146% of target from 127% in 2022. This indicates an enhanced ability to withstand the effects of short-term industry cyclicality for larger, more established firms, and may also indicate superior target-setting.
Long-Term Incentives
Long-term incentive (LTI) values grew for half of the group, resulting in a median increase of 1.9%. Overall, there was notable variation within the group for year-over-year changes in target LTI values; outcomes ranged from -8.6% at the 25th percentile to +15% at the 75th. CEOs with higher increases generally had shorter tenures and are seeing their equity award values approach that of the typical E&P CEO, while reductions in grant values are likely a result of compensation programs which use a target number of shares to determine CEO awards. Of the six firms that decreased CEO LTI grant values, three had experienced one-year share price declines greater than 10%.
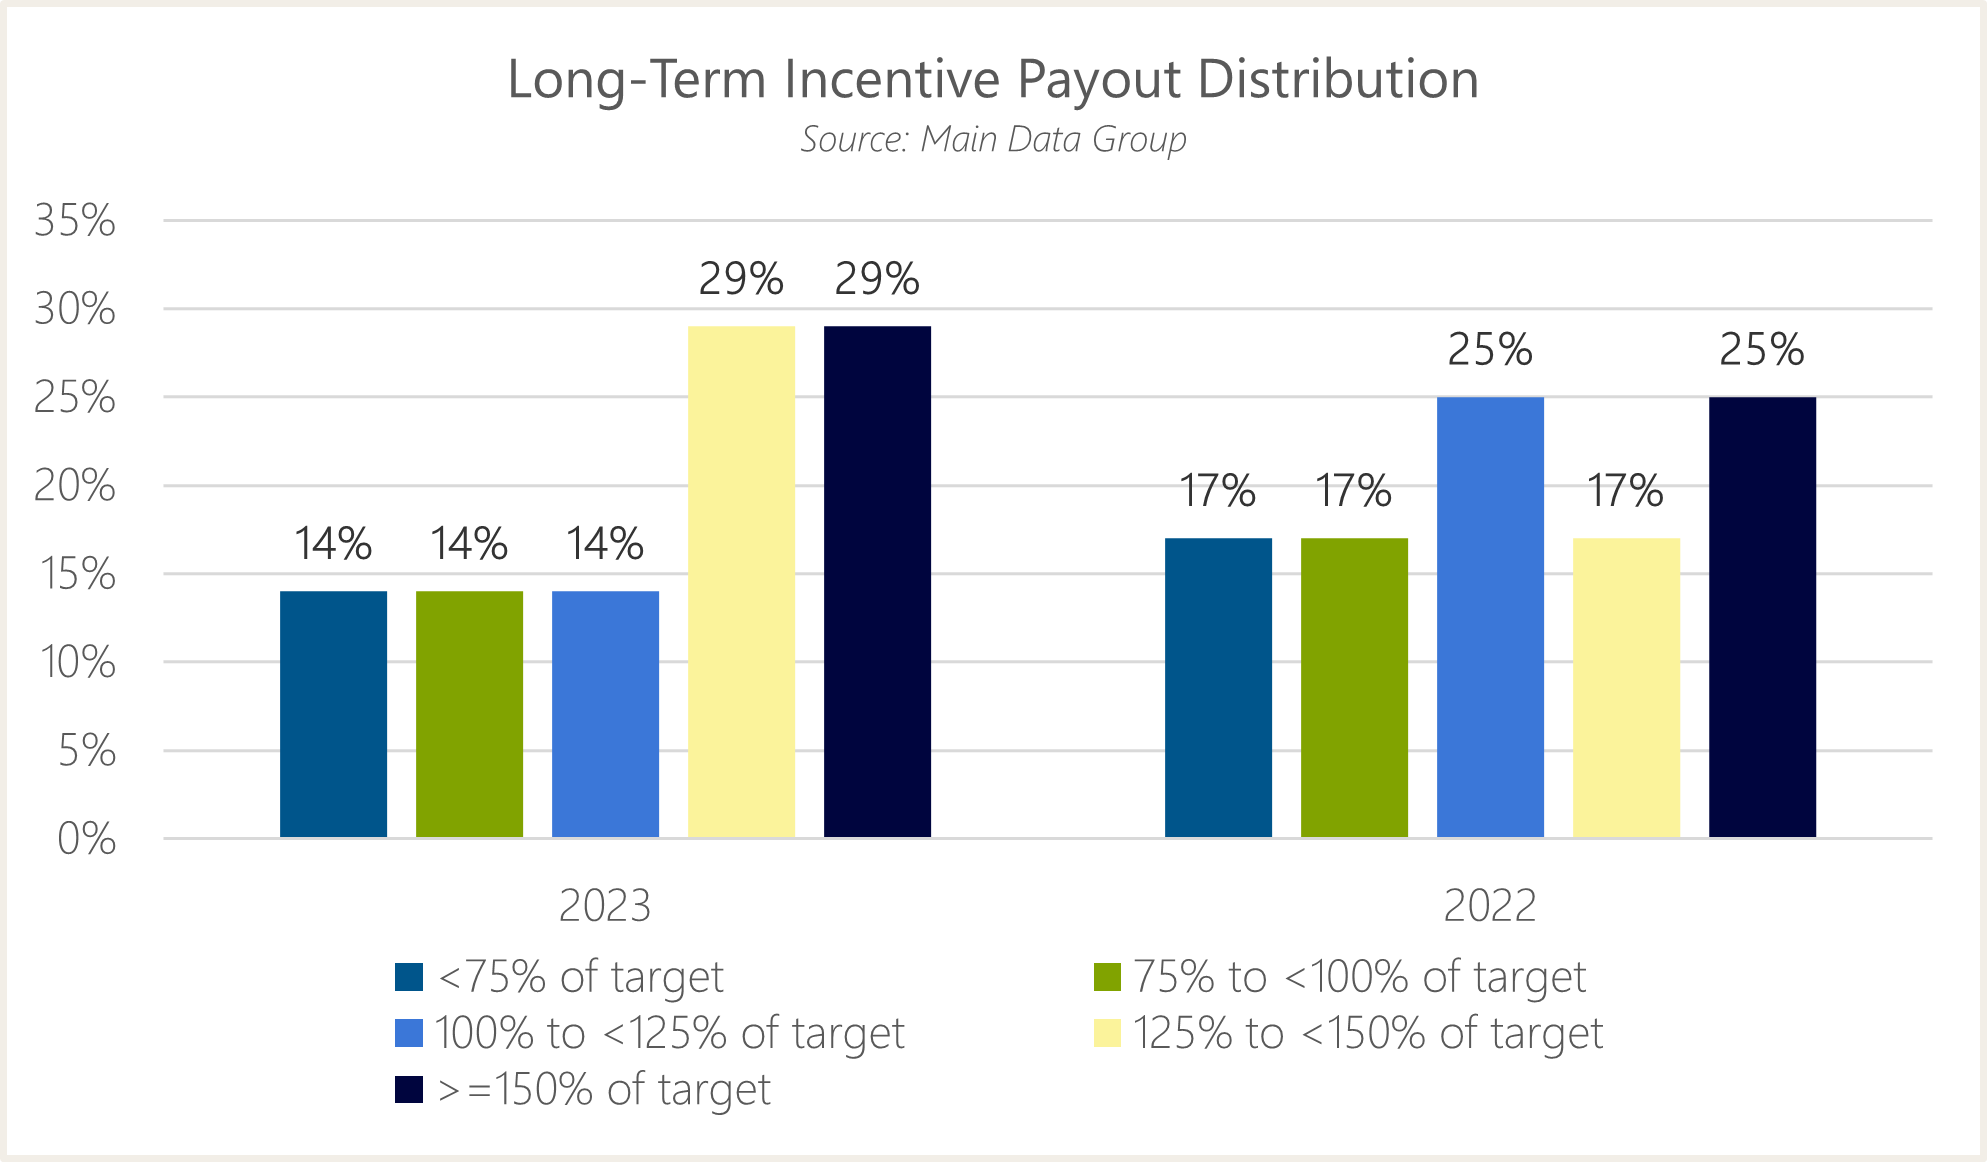
Payouts made during 2023 for long-term incentive cycles generally beginning in 2021 reflected even stronger company performance when compared to those of annual incentive plans, with a median at 141% of target. These results are an improvement when considering final payouts made during 2022 for performance grants made in 2020, which finalize at roughly 125% of target. The strength of the group’s long-term performance is mirrored by exceptional three-year total shareholder return results of 174% at median.
With a median increase of 6.9%, the five largest firms mostly saw LTI increases greater than that of the broader group. While payouts among the full E&P group increased overall from 2022 to 2023, the 2023 payouts of the largest five companies (113% at median) were lower than those of the broader group, decreasing on average from payouts made in 2022.
Conclusion and Outlook for 2024
As firms have generally reverted to standard, pre-COVID compensation structures and practices and, given the strength of shareholder returns for the E&P sector in recent years, we expect to see CEO compensation continue to increase in 2024. This means a continuation of historical progression for guaranteed pay components like base salary, increases to annual incentives that are proportional to that of base salaries, and above-average growth for long-term incentive awards. Incentive plan designs will likely be subject to change as companies look for an optimal balance of financial, production, and safety/sustainability goals to best reflect the current governance landscape and a historic wave of merger and acquisition activity.